
Price moved mostly sideways during Friday’s session, managing to stay just above the invalidation point on the daily chart.
I still have two wave counts for you. While price remains within the range of our confidence / invalidation points both wave counts will remain valid. We should have clarity next week.
Click on the charts below to enlarge.
Main Wave Count.
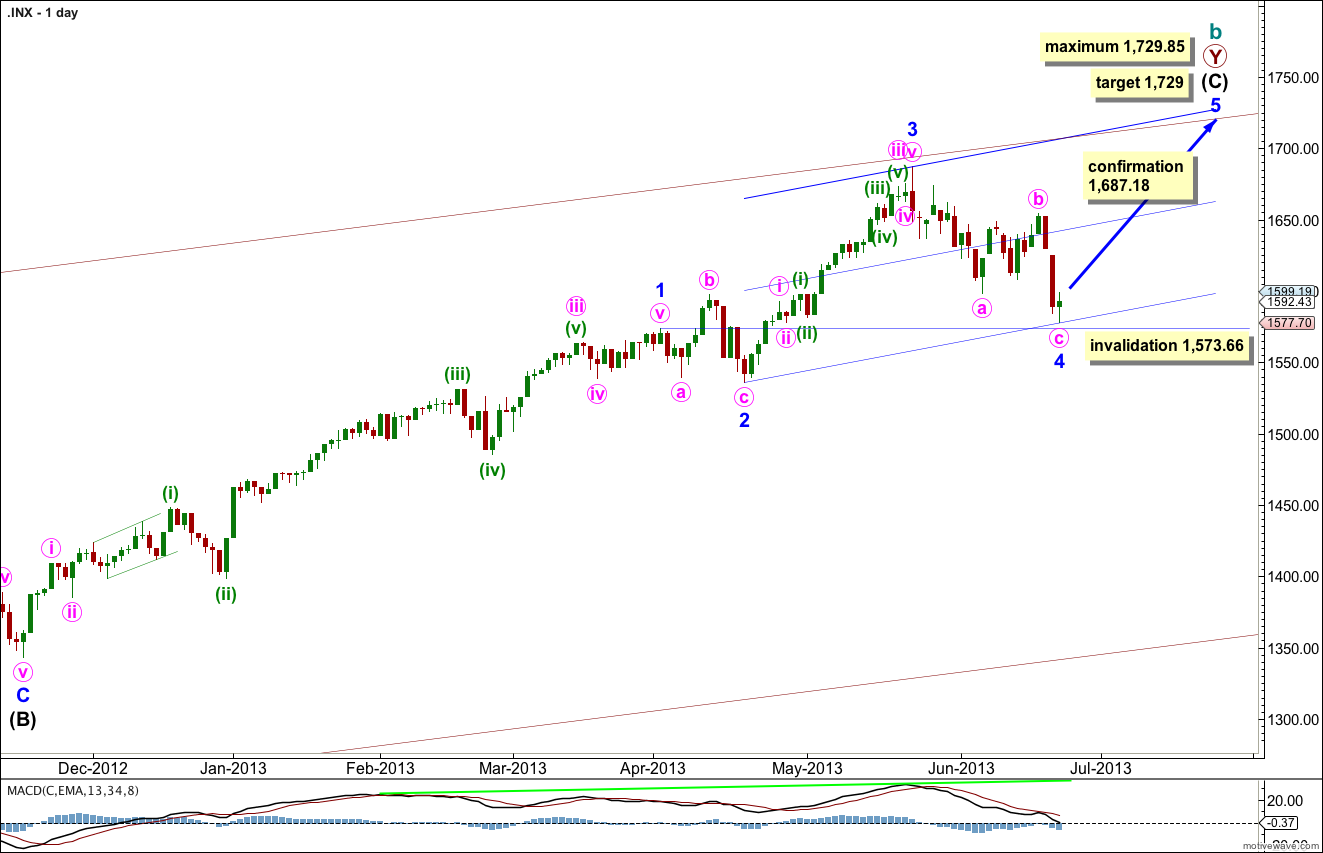
The bigger picture sees upwards movement from the end of the “credit crunch” at 666.76 as a double zigzag structure for a cycle degree b wave lasting so far 4.25 years. The second zigzag is almost complete. When it is done we should see another crash to make substantial new lows below 666.76, if the main monthly wave count is correct.
Within intermediate wave (C) I have moved the labeling for the end of minor wave 1 lower, leaving minor wave 2 as an expanded flat correction. This still agrees with MACD as the strongest momentum is within the third wave of intermediate wave (C).
Minor wave 3 is just 8.82 points longer than 0.618 the length of minor wave 1. I would expect the upcoming minor wave 5 to reach equality with minor wave 3. This would be achieved at 1,729. At 1,729.85 exactly is the maximum point for upwards movement because minor wave 3 may not be the shortest wave.
At 1,729 intermediate wave (C) would be 11 points short of equality with the orthodox length of intermediate wave (A).
If minor wave 4 were to continue any lower it may not move into minor wave 1 price territory. This wave count is invalidated with movement below 1,573.66
Draw the channel about intermediate wave (C) using Elliott’s second technique. Draw the first trend line from the lows of minor waves 2 to 4, then place a parallel copy upon the hight of minor wave 3. Expect minor wave 5 to end about the mid line, or to find resistance at the upper edge.
The very wide maroon trend channel shown here is copied over from the monthly chart. We may find this movement ends as it finds resistance at the upper trend line.
At this stage there is no divergence on the daily chart level with price trending higher and MACD also trending higher. This is an indication that the upwards trend remains in place. I would expect to see some classic technical divergence before the end of this trend.
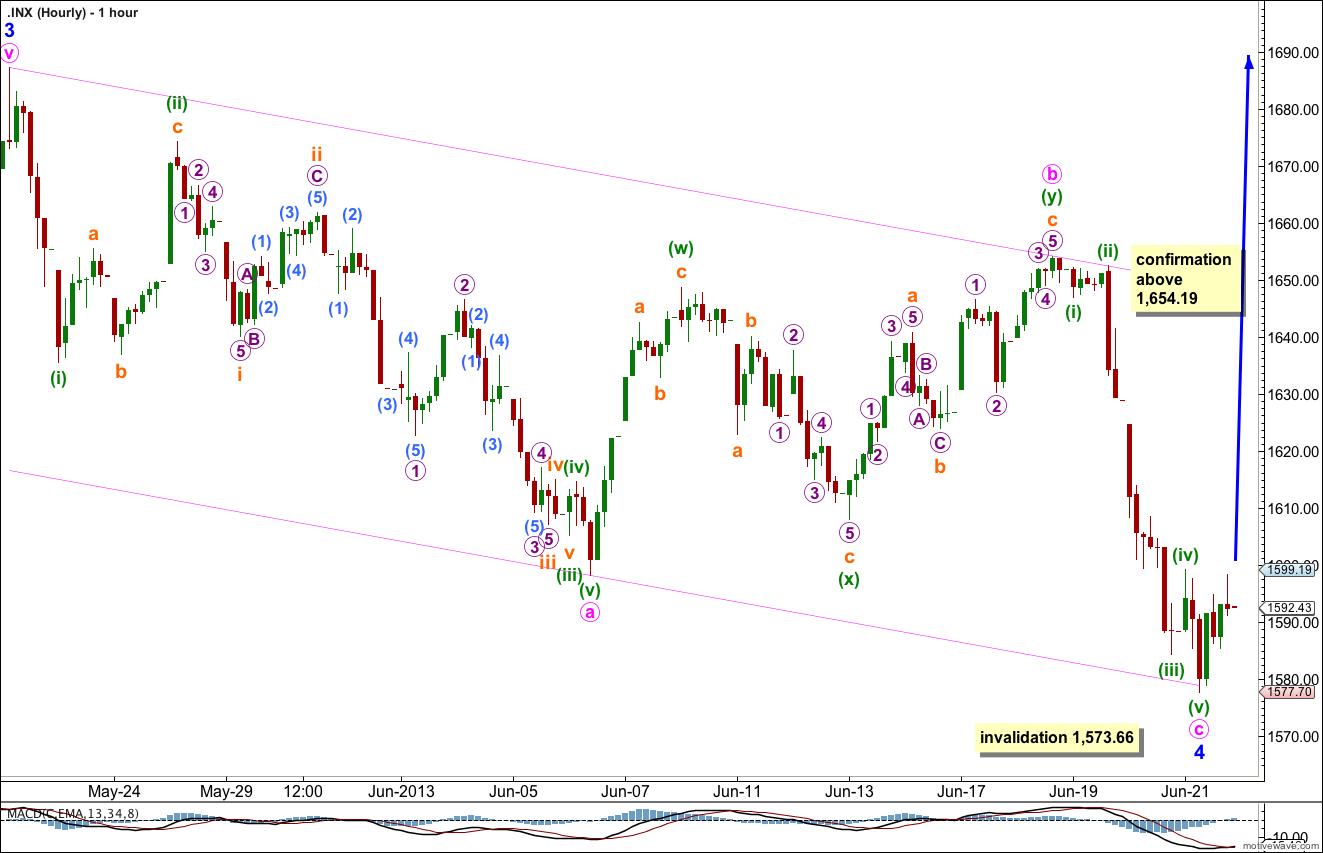
Last analysis expected that minute wave c was most likely over, but allowed for the possibility that it could move just a little lower. It has moved lower and found support about the lower edge of the parallel channel containing minor wave 4.
There is no Fibonacci ratio between minute waves a and c.
Ratios within minute wave a are: minuette wave (iii) has no Fibonacci ratio to minuette wave (i), and minuette wave (v) is just 0.12 points longer than 0.236 the length of minuette wave (iii).
Ratios within minuette wave (iii) within minute wave a ratios are: subminuette wave iii is 0.45 points short of 1.618 the length of subminuette wave i, and subminuette wave v has no Fibonacci ratio to either of subminuette waves i or iii.
Ratios within subminuette wave iii of minuette wave (iii) of minute wave a are: micro wave 3 is 1.94 points short of equality with micro wave 1, and micro wave 5 has no Fibonacci ratio to either of micro waves 1 or 3.
Within minuette wave (w) of minute wave b subminuette wave c is 1.25 points short of 0.382 the length of subminuette wave a.
Within minuette wave (x) of minute wave b there is no Fibonacci ratio between subminuette waves a and c.
Within minuette wave (y) of minute wave b subminuette wave c is 2.5 points short of equality with subminuette wave a.
Within minute wave c there are no adequate Fibonacci ratios between minuette waves (i), (iii) and (v).
It is extremely likely that minor wave 4 is over with minute wave c finding support at the lower edge of the channel. There is almost no room left for minor wave 4 to move. At the very least next week I would expect price to rise to fill the gap in minuette wave (iii) of minute wave c. Thereafter, if price continues to rise above 1,654.19 we may have some more confidence in this wave count. Movement to a new high above 1,687.18 would provide full confidence in this wave count.
Alternate Wave Count.
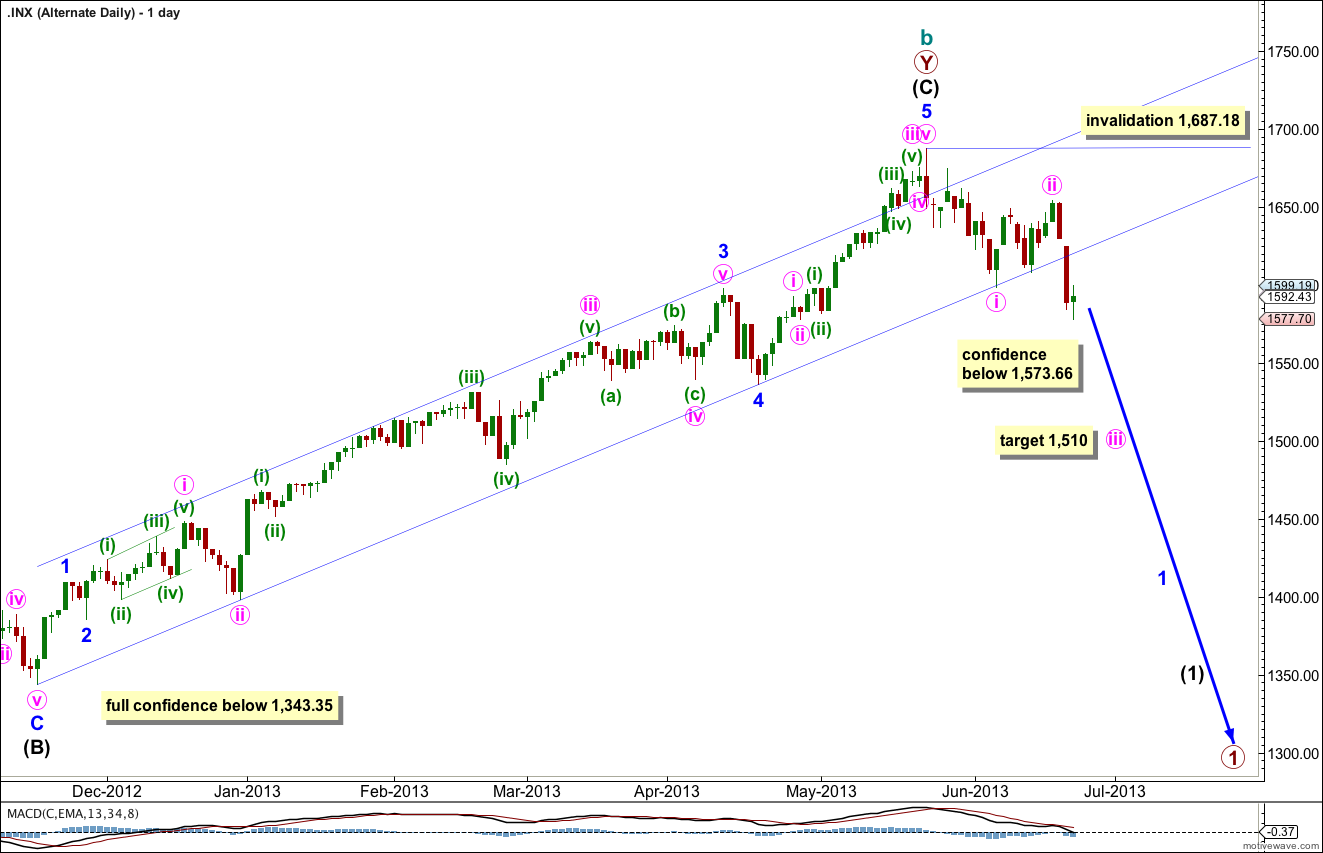
The labeling here within intermediate wave (C) goes back to my previous wave count up to 15th May, 2013. Within intermediate wave (C) it may have been minor wave 3 which was extended and not minor wave 1. This is more common. The problem with this wave count (and the reason why I changed it) is that it does not agree with MACD: the strongest upwards momentum within intermediate wave (C) impulse is within minor wave 5, and also the steepest slope is within minor wave 5. For the S&P 500 this is uncommon as normally the third wave exhibits strongest momentum and steepest slope. For these reasons this wave count is an alternate.
Within intermediate wave (C) there are no Fibonacci ratios between minor waves 1, 3 and 5.
A parallel channel drawn as a best fit about intermediate wave (C) is clearly breached by downwards movement. This may be an early indication that we have seen a trend change.
At 1,510 minute wave iii would reach 1.618 the length of minute wave i.
Movement below 1,573.66 would provide some confidence in this wave count as at that stage the main wave count would be invalidated. Movement below 1,343.35 would provide full and final confidence that we have seen a trend change at cycle degree and price should continue to fall with strong momentum ending significantly below 666.76.
Within the new downwards trend minor wave 2 may not move beyond the start of minor wave 1. This wave count is invalidated with movement above 1,687.18.
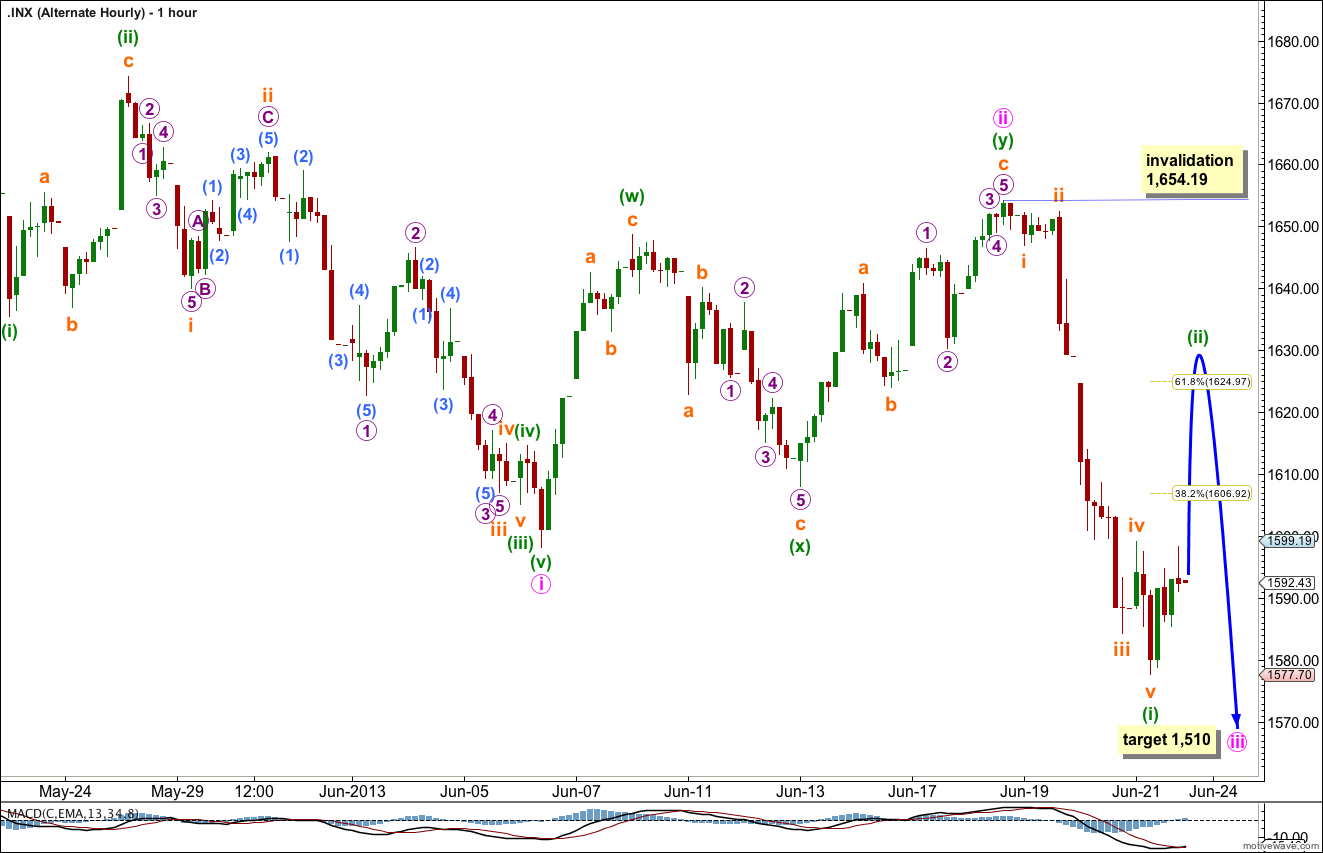
This alternate also expects upwards movement early next week for a second wave correction. If minuette wave (ii) is to fill the gap in subminuette wave iii of minuette wave (i) then it should correct to just above the 0.618 Fibonacci ratio, just above 1,624.97.
Thereafter, this alternate expects an increase in downwards momentum.
Minuette wave (ii) may not move beyond the start of minuette wave (i). This wave count is invalidated with movement above 1,654.19.
Lara,
It looks like 3 waves down on the daily chart from the recent high, but the main wave count has been invalidated. Could this still be a 4th wave correction (maybe over now), or maybe a series of 1s and 2s that will accelerate to the downside soon?
Peter
At this stage yes, it could still be a fourth wave correction, but it is now looking very odd and too large for this.
I will have an alternate wave count for you now which sees cycle wave b as incomplete. The main wave count must see cycle wave b as complete because of the clear channel breach about intermediate wave (C).