
Last analysis of AAPL expected a little upwards movement towards a short term target at 440.70 before more downwards movement for a third wave. Price barely moved sideways failing to reach the target before it turned lower with an increase in momentum. This exactly what a third wave should look like.
Price has moved below the confidence point at 418.90 so I now have more confidence in the targets.
I have adjusted the wave count on the hourly chart. It does not make a difference to the expected direction, which is still down.
Click on the charts below to enlarge.
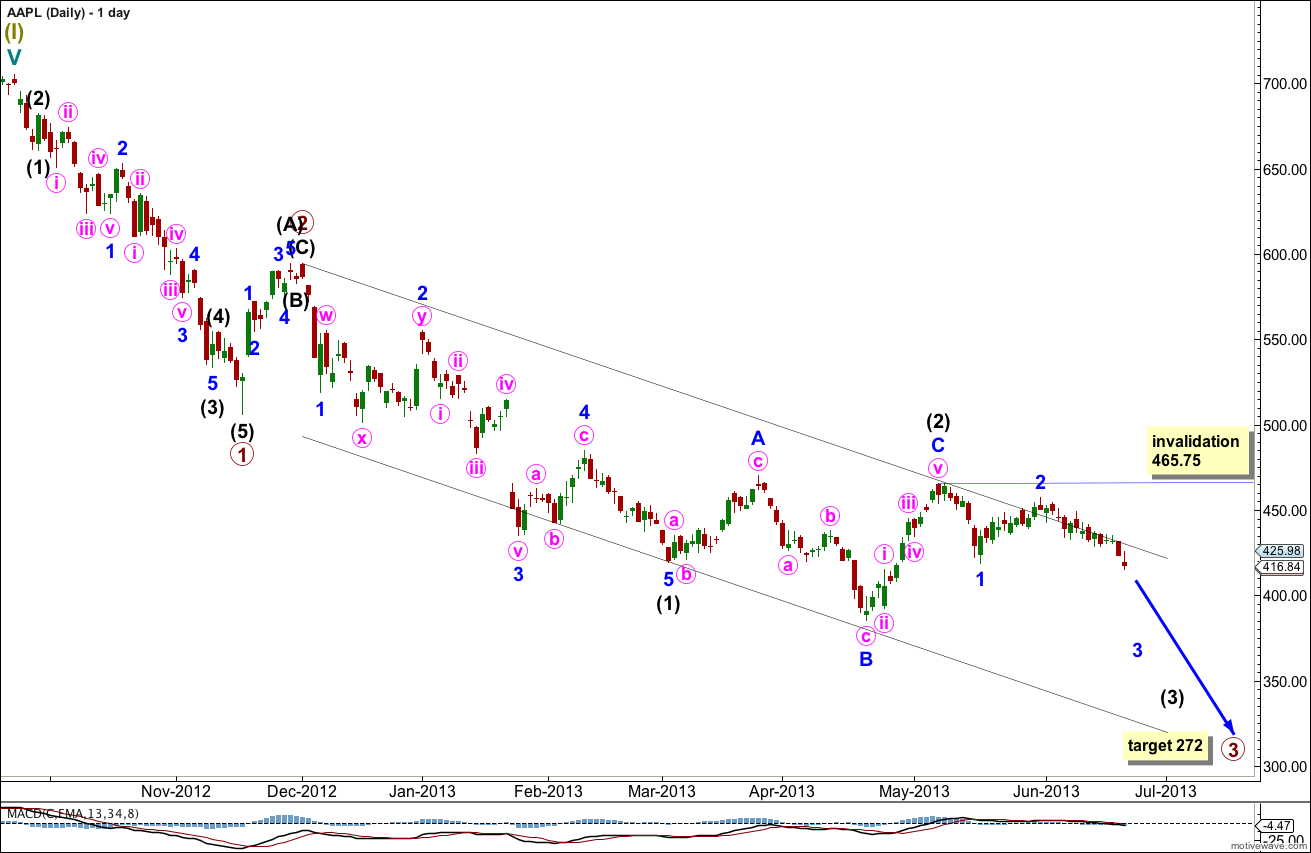
This wave count expects a five wave impulse for a cycle degree wave a is unfolding to the downside. Within the impulse primary waves 1 and 2 are complete. Primary wave 3 is extending. Within primary wave 3 intermediate waves (1) and (2) are complete.
I have removed targets for minor wave 3 and intermediate wave (3). Because we have not seen a strong increase in downwards momentum yet I expect the middle of this third wave has not yet passed. I expect momentum to increase. Targets calculated may have been too high. As these waves get closer to completion I will use multiple wave degrees to calculate targets.
At 272 primary wave 3 would reach 1.618 the length of primary wave 1. This long term target is still months away.
Within intermediate wave (3) no second wave correction may move beyond the start of its first wave. This wave count is invalidated with movement above 465.75.
I have considered various possibilities for this downwards movement from the high labeled primary wave 2. What is most clear is that the middle of primary wave 3 has not yet passed because we have not seen momentum increase beyond that seen for primary wave 1. Primary wave 3 cannot be complete.
When this next five wave impulse labeled primary wave 3 is complete we shall have to consider that may be the end of cycle wave a as a three wave zigzag if super cycle wave II is unfolding as a big flat correction. I will consider that alternative at the appropriate time if it remains viable.
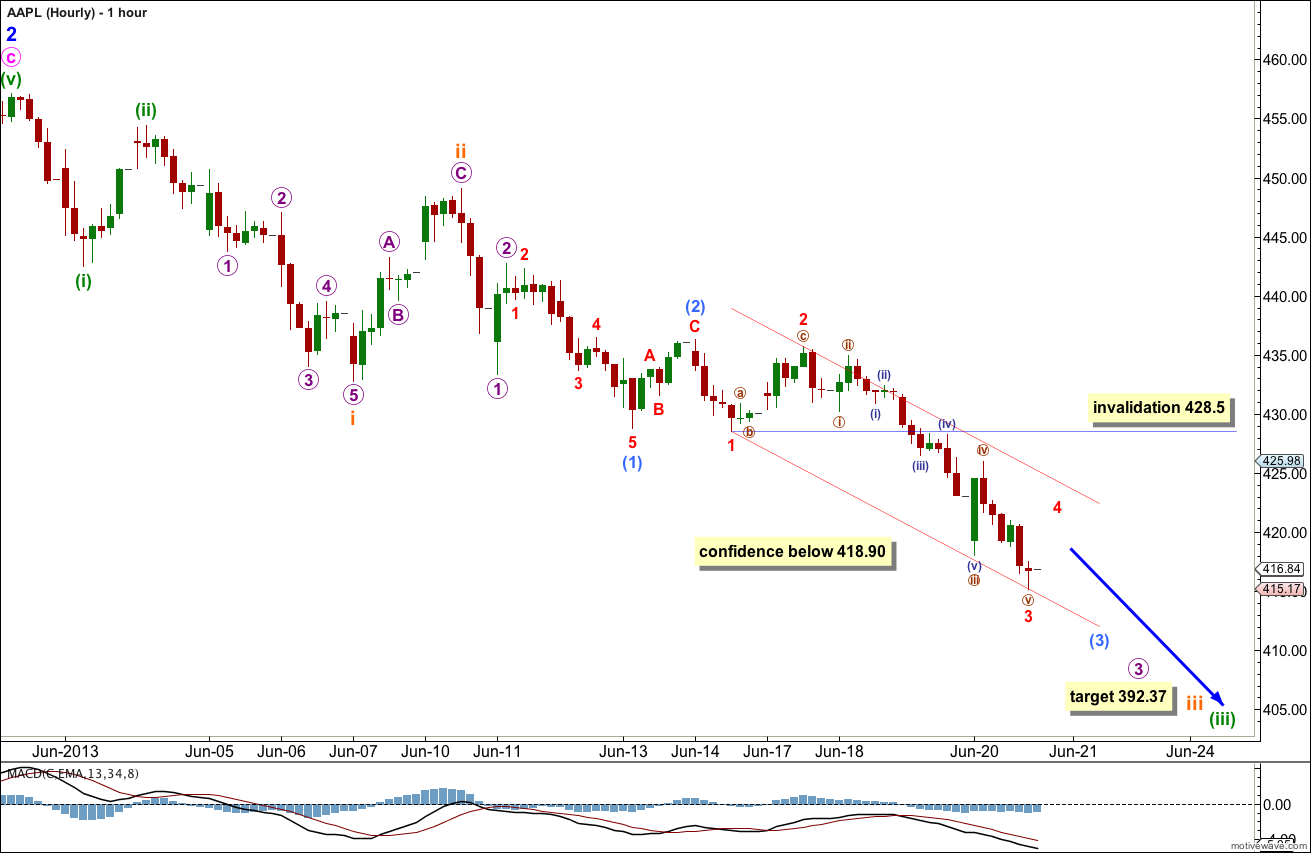
My last hourly wave count had minute wave i as a leading expanding diagonal. But because the upwards movement expected for minute wave ii did not happen that wave count had a low probability. Leading diagonals are normally followed by very deep second waves.
It is extremely common to see an impulse begin with a series of overlapping first and second waves, especially a third wave impulse.
I have also moved the degree of labeling down one degree. It does not look like AAPL has just passed the middle of a third wave because there has not been an increase in momentum on the daily chart. This is most likely just minute wave i.
At 392.37 subminuette wave iii would reach 2.618 the length of subminuette wave i.
We should expect to see a continuation of downwards movement with a series of fourth wave corrections along the way, increasing in size and duration.
Within submicro wave (3) minuscule wave 4 may not move into minuscule wave 1 price territory.
On the way down the invalidation point must move upwards for each fourth wave correction, to the low of each first wave counterpart to the fourth wave.
As each third wave completes the parallel channel may be redrawn about it using the same technique as this channel. Draw the first trend line from the lows of minuscule waves 1 to 3, then place a parallel copy upon the high of minuscule wave 2. Expect minuscule wave 4 to move price a little higher and to find resistance about the upper edge of the parallel channel.
Overall I am expecting downwards movement for the next few days from AAPL.