
Yesterday’s analysis expected upwards movement. We did see price move higher and the wave count remains valid, but the lack of momentum and sideways movement over the last few sessions indicates a triangle may be almost completing. I have a new alternate hourly wave count for you for this possibility.
The expectation of direction for tomorrow differs, but overall the main trend remains the same.
Click on the charts below to enlarge.
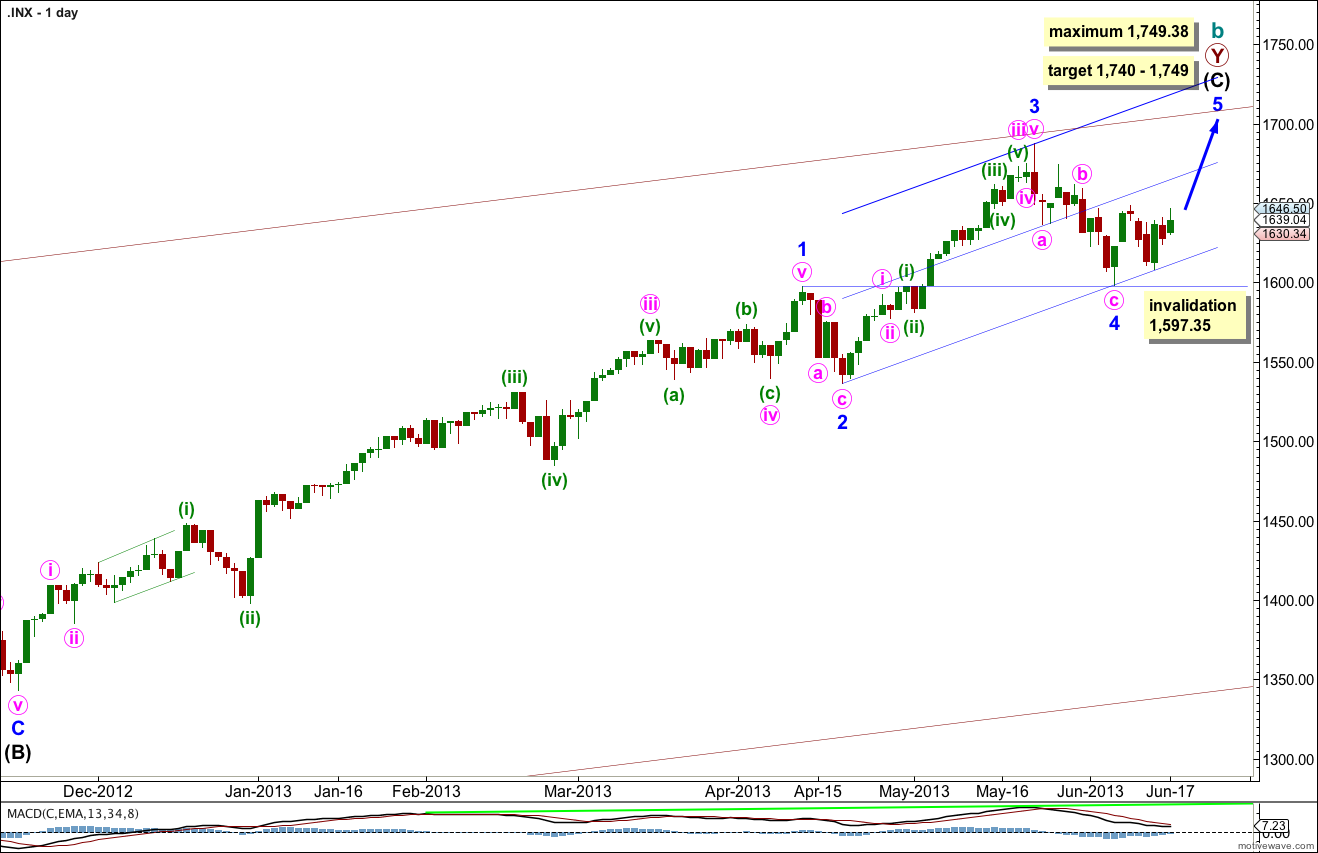
The bigger picture sees upwards movement from the end of the “credit crunch” at 666.76 as a double zigzag structure for a cycle degree b wave lasting so far 4.25 years. The second zigzag is almost complete. When it is done we should see another crash to make substantial new lows below 666.76, if the main monthly wave count is correct. If, however, the next upwards wave sees an increase in momentum beyond that seen for minor wave 3 then the alternate very bullish monthly wave count must be seriously considered. I will be watching momentum carefully over the next few weeks.
Within intermediate wave (C) minor wave 1 was extended.
Minor wave 3 is just 5.82 points short of 0.618 the length of minor wave 1. I would expect the upcoming minor wave 5 to reach equality with minor wave 3. This would be achieved at 1,749.38, and this is also a maximum point for upwards movement because minor wave 3 may not be the shortest wave.
At 1,740 intermediate wave (C) would reach equality with the orthodox length of intermediate wave (A). This gives us a 9 point target zone, and I favour the upper end of the zone because it is calculated at a lower wave degree.
If minor wave 4 were to continue any lower it may not move into minor wave 1 price territory. This wave count is invalidated with movement below 1,597.35.
Draw the channel about intermediate wave (C) using Elliott’s second technique. Draw the first trend line from the lows of minor waves 2 to 4, then place a parallel copy upon the hight of minor wave 3. Add a mid line to the channel. Expect minor wave 5 to end about the mid line, or to find resistance at the upper edge.
The very wide maroon trend channel shown here is copied over from the monthly chart. We may find this movement ends as it finds resistance at the upper trend line.
At this stage there is no divergence on the daily chart level with price trending higher and MACD also trending higher. This is an indication that the upwards trend remains in place. I would expect to see some classic technical divergence before the end of this trend.
Main Hourly Wave Count.
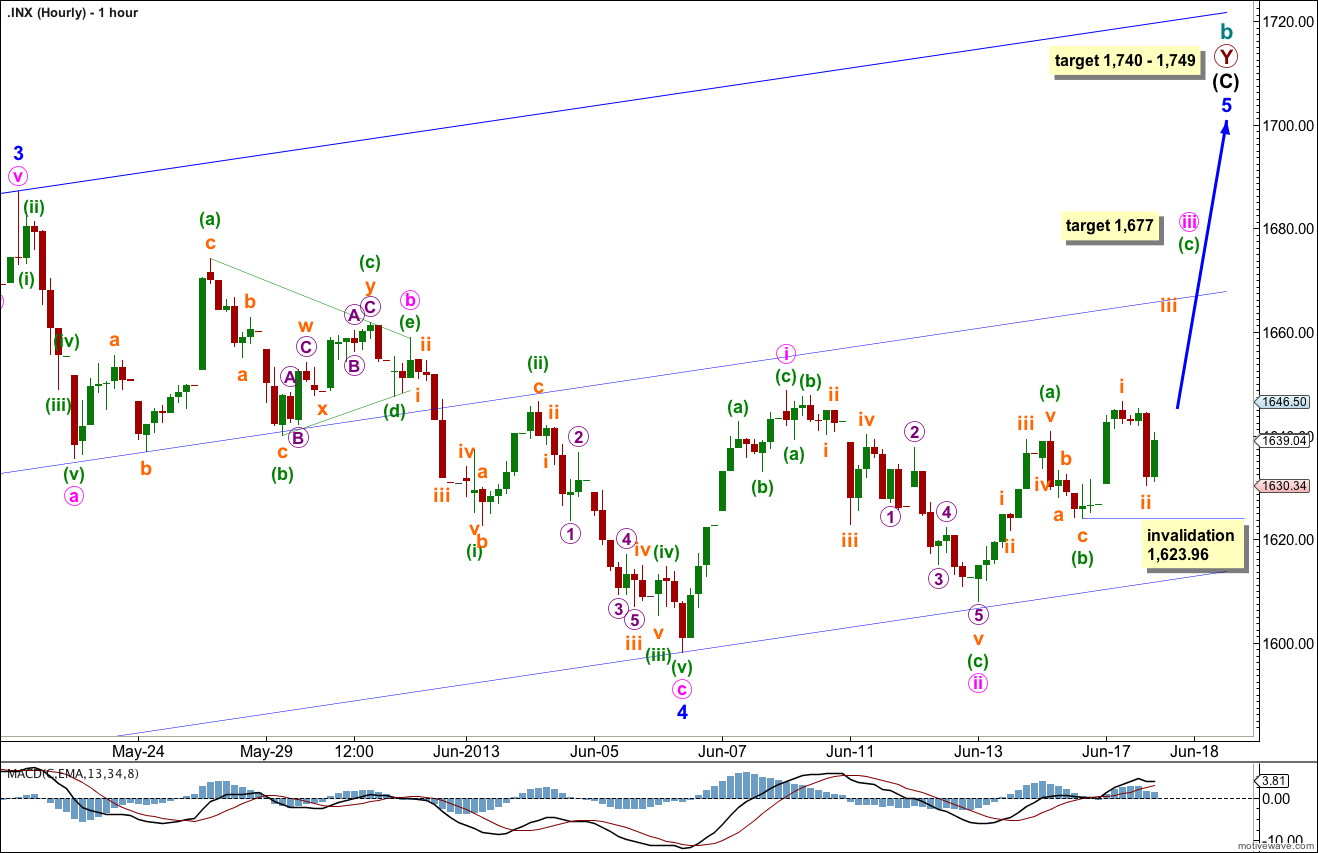
It remains possible that we are seeing an diagonal unfold to the upside. However, with price failing to make a new high above the high of minute wave i at 1,648.69 during Monday’s session the alternate below has presented itself as a possibility. For this main wave count the third wave of the diagonal must move beyond the end of the first wave; we must see price move above 1,648.69 very soon for this wave count to remain valid.
At this stage within minute wave iii minuette wave (c) cannot be over, and it looks like it would be extending. At 1,677 minuette wave (c) would reach 1.618 the length of minuette wave (a).
If minute wave iii is longer than minute wave i then the diagonal should be expanding. This structure would be big enough to reach the final target.
Within minuette wave (c) subminuette wave ii may not move beyond the start of subminuette wave i. This wave count is invalidated tomorrow if we see movement below 1,623.96. If that happens the alternate below would be confirmed.
Alternate Hourly Wave Count.
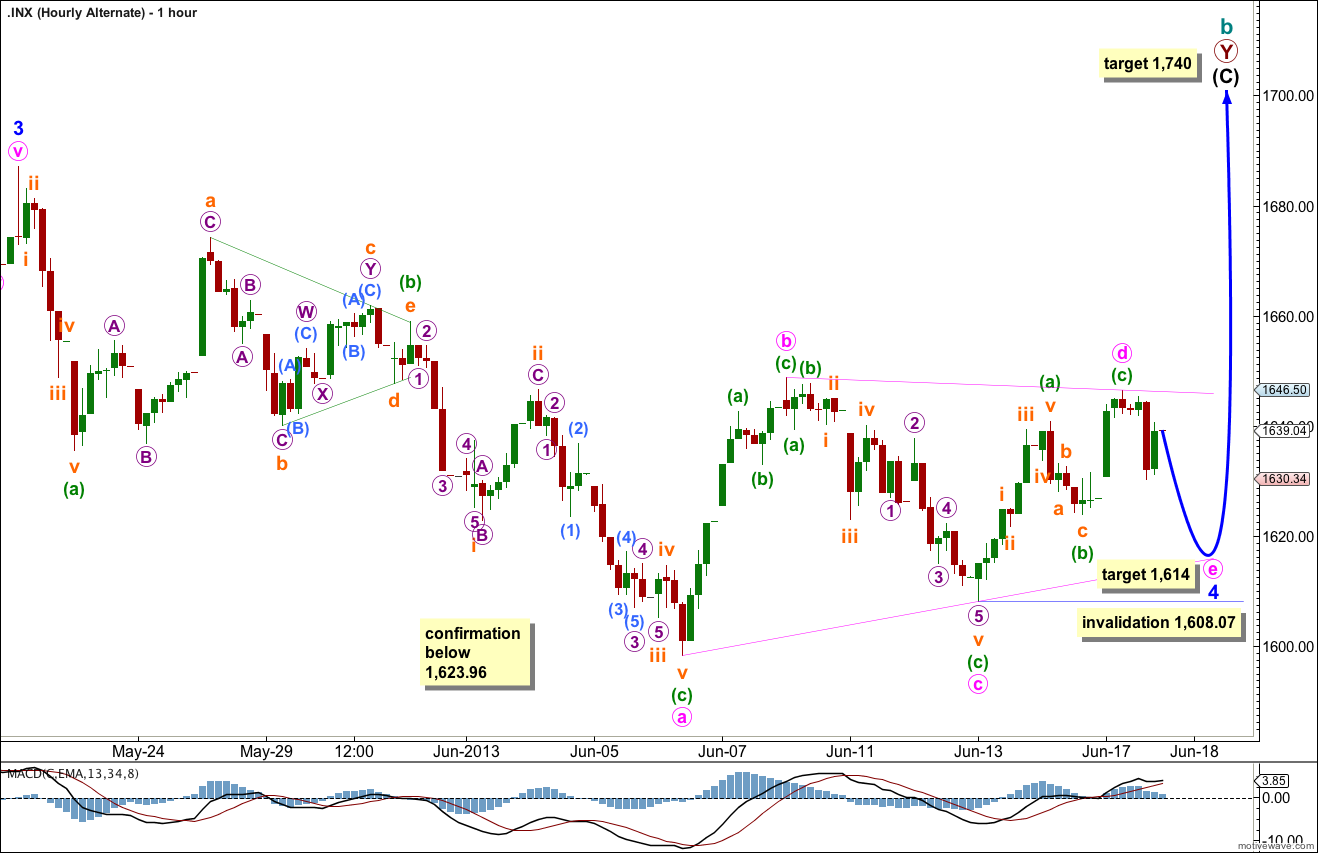
Ending diagonals and triangles are extremely similar. Both subdivide into a series of zigzags. The difference is triangles trend sideways and diagonals trend either up or down. The sideways trend over the last few days indicates a triangle may be completing.
This would see minor wave 4 incomplete and longer in duration than its counterpart minor wave 2 which lasted only five days. That’s okay, zigzags are brief movements and triangles are time consuming movements so for these two structures we should not expect them to be the same duration. They do provide nice alternation.
If this alternate wave count is correct then minor wave 4 is incomplete. The final subwave of the triangle, minute wave e needs to be complete. It may end about 85% the length of minute wave d at 1,614.
This triangle looks most like a barrier triangle. Minute wave d is deeper than usual, it is 95% of minute wave c. This gives the B-D trend line a close to flat look. This is important. It means that minute wave e may not itself subdivide into a triangle and so should be over soon, and it gives us some information about the upcoming minor wave 5.
Following a barrier triangle the fifth wave is either a brief, rapid movement, or a long extension. In this case because minor wave 3 is shorter than minor wave 1 minor wave 5 may not extend. Minor wave 5 should be a brief, rapid movement. It may be over sooner than the expected few weeks.
Within a barrier or contracting triangle minute wave e may not move beyond the end of minute wave c. This wave count is invalidated with movement below 1,608.07.
For this alternate when the triangle is completed I will use minor wave degree to add to the target calculation for cycle wave b to end. The target at 1,740 may change, it may move lower.
Ascending Triangle setup with the IHS target 1687.18 it would be one great pop and drop and back up again 1750.00
“ascending triangle” is the Elliott wave equivalent of a diagonal trending upwards.
Thanks.
For the stock I am looking at (BHP-ASX)I think it is highly unlikely to be a triangle that would thrust up. It may be a 4th wave triangle of an impulse down or something else. Was just curious. I don’t think you get ASX data but I am going to see whether or not I can develop CSV data files from eSignal. Thanks!
I am looking at different stocks and curious whether a 33% B wave retracement of the A wave would satisfy the criteria for a triangle. The general retracement is around 50% but I was wondering how probable a 33% B wave retracement would be when it comes to triangles?
Unlikely.
You’re welcome to send me data or a chart. If you have data in .csv format I can import it into Motive Wave and do a wave count for you.
It is my experience that triangle subwaves are often about 85% of the prior wave, with one often close to 61.8%
Lara,
The alternate triangle count lines up nicely with upcoming events. The Fed announcement on Wednesday could lead to the brief, rapid movement you talk about as a possibility for wave 5. It could get interesting very soon, but I am on the sidelines for now.
Peter
Yep. Me too.
Either way, this movement should be over before the year or indeed the season is done.
October often seems to be a month for major turns, but I’m struggling to see how this movement could last until then…