
Last analysis expected upwards movement for Friday’s session. Price reached a slight new high but moved downwards during the session, remaining above the invalidation point on the hourly chart.
The wave count remains the same with just the one daily and one hourly chart for you.
Click on the charts below to enlarge.
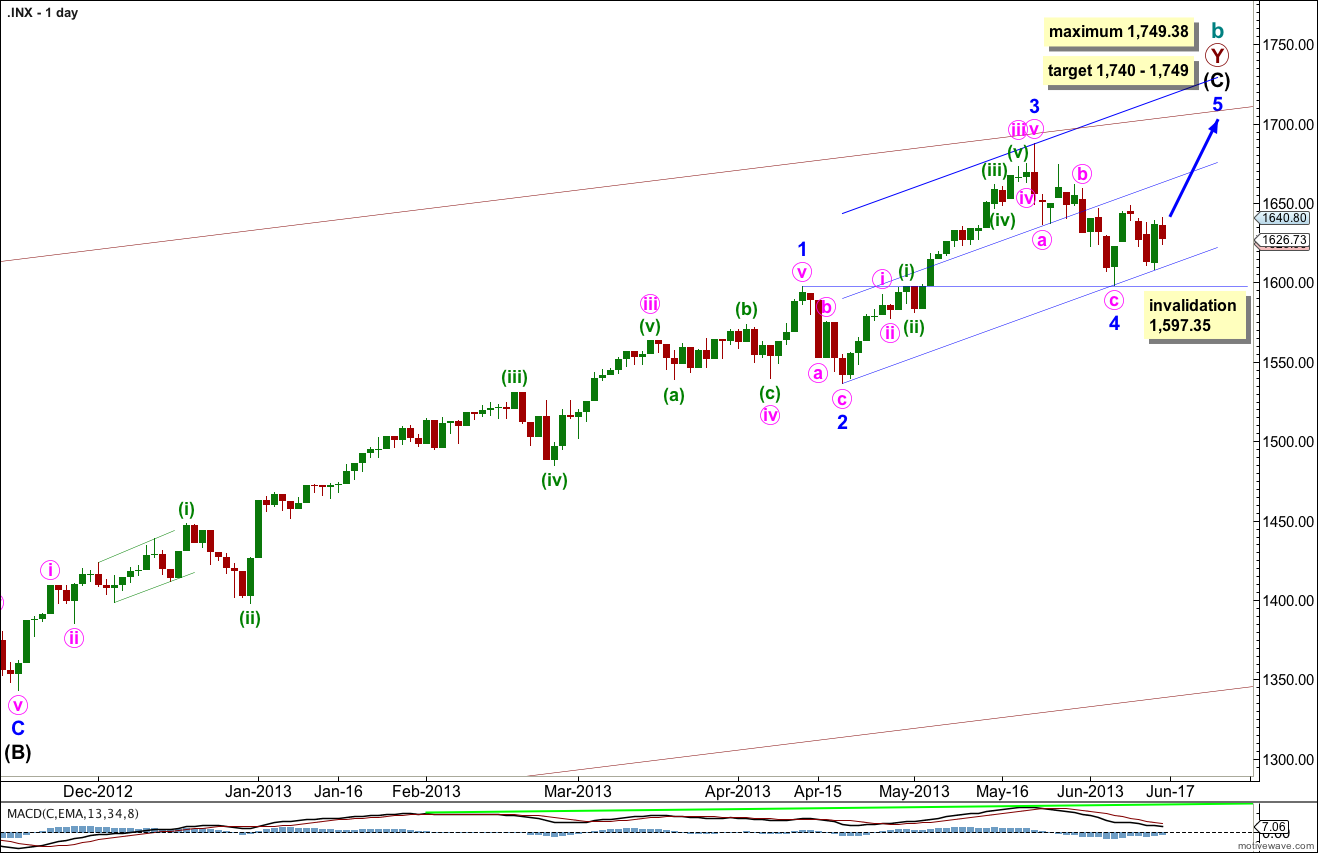
The bigger picture sees upwards movement from the end of the “credit crunch” at 666.76 as a double zigzag structure for a cycle degree b wave lasting so far 4.25 years. The second zigzag is almost complete. When it is done we should see another crash to make substantial new lows below 666.76, if the main monthly wave count is correct. If, however, the next upwards wave sees an increase in momentum beyond that seen for minor wave 3 then the alternate very bullish monthly wave count must be seriously considered. I will be watching momentum carefully over the next few weeks.
Within intermediate wave (C) minor wave 1 was extended.
Minor wave 3 is just 5.82 points short of 0.618 the length of minor wave 1. I would expect the upcoming minor wave 5 to reach equality with minor wave 3. This would be achieved at 1,749.38, and this is also a maximum point for upwards movement because minor wave 3 may not be the shortest wave.
At 1,740 intermediate wave (C) would reach equality with the orthodox length of intermediate wave (A). This gives us a 9 point target zone, and I favour the upper end of the zone because it is calculated at a lower wave degree.
If minor wave 4 were to continue any lower it may not move into minor wave 1 price territory. This wave count is invalidated with movement below 1,597.35.
Draw the channel about intermediate wave (C) using Elliott’s second technique. Draw the first trend line from the lows of minor waves 2 to 4, then place a parallel copy upon the hight of minor wave 3. Add a mid line to the channel. Expect minor wave 5 to end about the mid line, or to find resistance at the upper edge.
The very wide maroon trend channel shown here is copied over from the monthly chart. We may find this movement ends as it finds resistance at the upper trend line.
At this stage there is no divergence on the daily chart level with price trending higher and MACD also trending higher. This is an indication that the upwards trend remains in place. I would expect to see some classic technical divergence before the end of this trend.
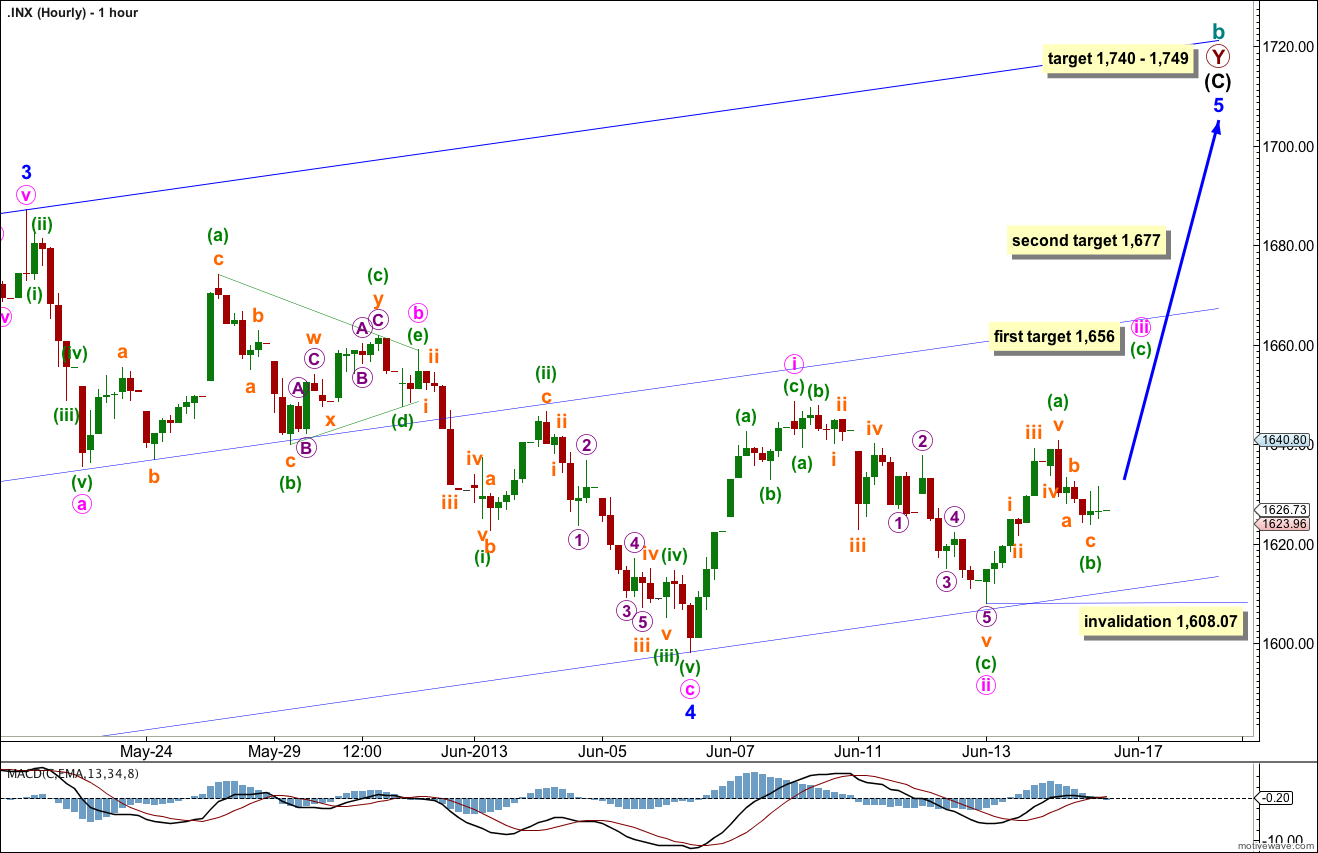
Downwards movement for Friday’s session may be minuette wave (b) within minute wave iii.
Within minute wave iii zigzag at 1,656 minuette wave (c) would reach equality in length with minuette wave (a). At this point the diagonal would be contracting and the target for the end to upwards movement for cycle wave b would be too far away. I would consider moving the diagonal structure down one degree as it may be a leading diagonal for minute wave i within minor wave 5.
At 1,677 minuette wave (c) would reach 1.618 the length of minuette wave (a). At this point the diagonal would be expanding and could reach the end target for cycle wave b. I would leave the degree of labeling within the diagonal structure the same.
If minuette wave (b) within minute wave iii moves lower then targets for minute wave iii must move correspondingly lower also.
Minuette wave (b) may not move beyond the start of minuette wave (a). This wave count is invalidated with movement below 1,608.07.
Agree … Under 1636 to 1646 is a red flag with the futures nice ride up from 1591 area but this looks like it wants to go back down.
Lara,
Can you please clarify what strucutre minor wave 5 is? Is it an ending diagonal, which explains why minute I to III are all 3-wave structures?
At this stage I’m calling it an ending diagonal.
Mostly because that first wave up looks so much like a three.
The diagonal could also be leading if we move its degree of labeling down one, for minute wave i.