
Yesterday’s analysis had two hourly wave counts with confirmation / invalidation points. Movement below 1,632.98 invalidated the main hourly wave count and confirmed the alternate.
Click on the charts below to enlarge.
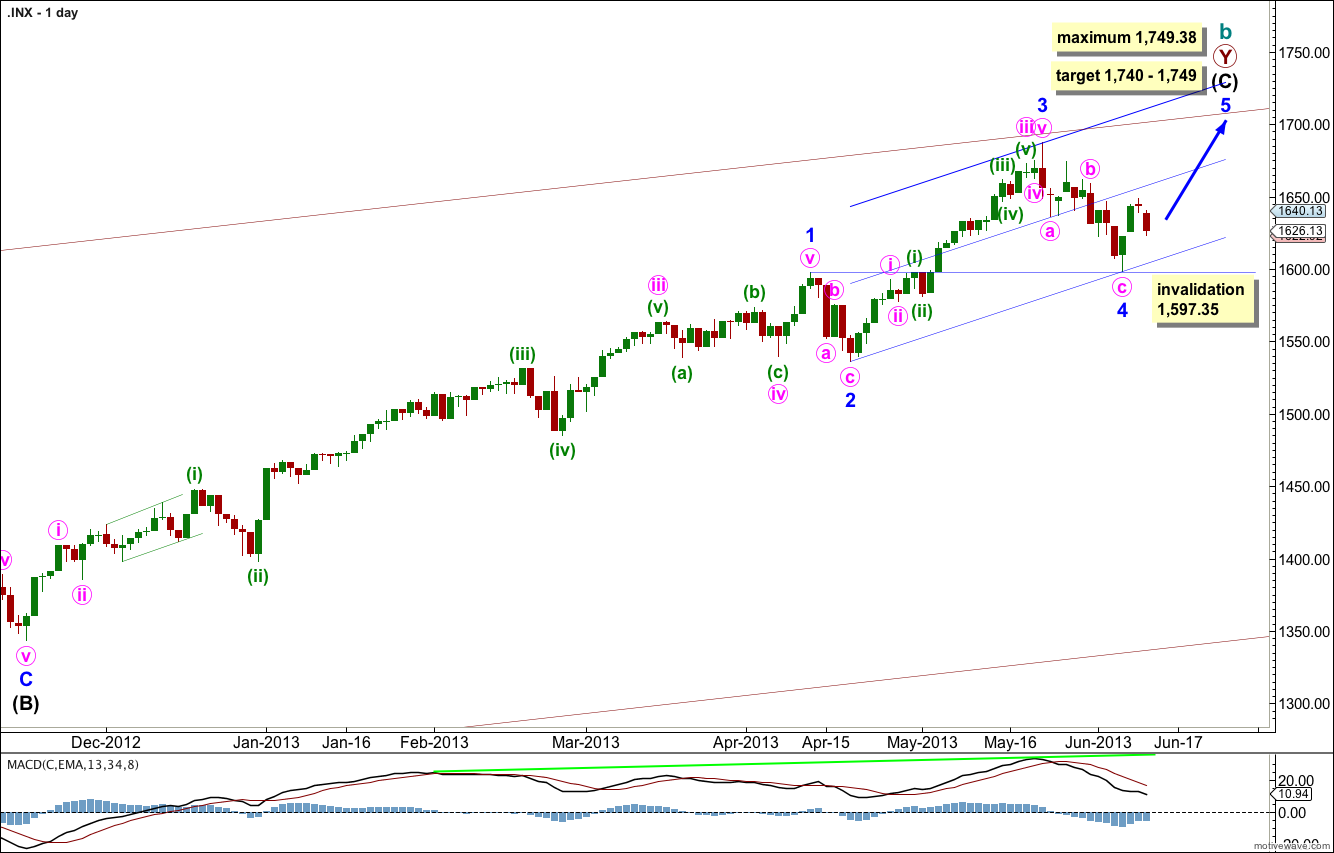
The bigger picture sees upwards movement from the end of the “credit crunch” at 666.76 as a double zigzag structure for a cycle degree b wave lasting so far 4.25 years. The second zigzag is almost complete. When it is done we should see another crash to make substantial new lows below 666.76, if the main monthly wave count is correct. If, however, the next upwards wave sees an increase in momentum beyond that seen for minor wave 3 then the alternate very bullish monthly wave count must be seriously considered. I will be watching momentum carefully over the next few weeks.
Within intermediate wave (C) minor wave 1 was extended.
Minor wave 3 is just 5.82 points short of 0.618 the length of minor wave 1. I would expect the upcoming minor wave 5 to reach equality with minor wave 3. This would be achieved at 1,749.38, and this is also a maximum point for upwards movement because minor wave 3 may not be the shortest wave.
At 1,740 intermediate wave (C) would reach equality with the orthodox length of intermediate wave (A). This gives us a 9 point target zone, and I favour the upper end of the zone because it is calculated at a lower wave degree.
If minor wave 4 were to continue any lower it may not move into minor wave 1 price territory. This wave count is invalidated with movement below 1,597.35.
Draw the channel about intermediate wave (C) using Elliott’s second technique. Draw the first trend line from the lows of minor waves 2 to 4, then place a parallel copy upon the hight of minor wave 3. Add a mid line to the channel. Expect minor wave 5 to end about the mid line, or to find resistance at the upper edge.
The very wide maroon trend channel shown here is copied over from the monthly chart. We may find this movement ends as it finds resistance at the upper trend line.
At this stage there is no divergence on the daily chart level with price trending higher and MACD also trending higher. This is an indication that the upwards trend remains in place. I would expect to see some classic technical divergence before the end of this trend.
Main Hourly Wave Count.
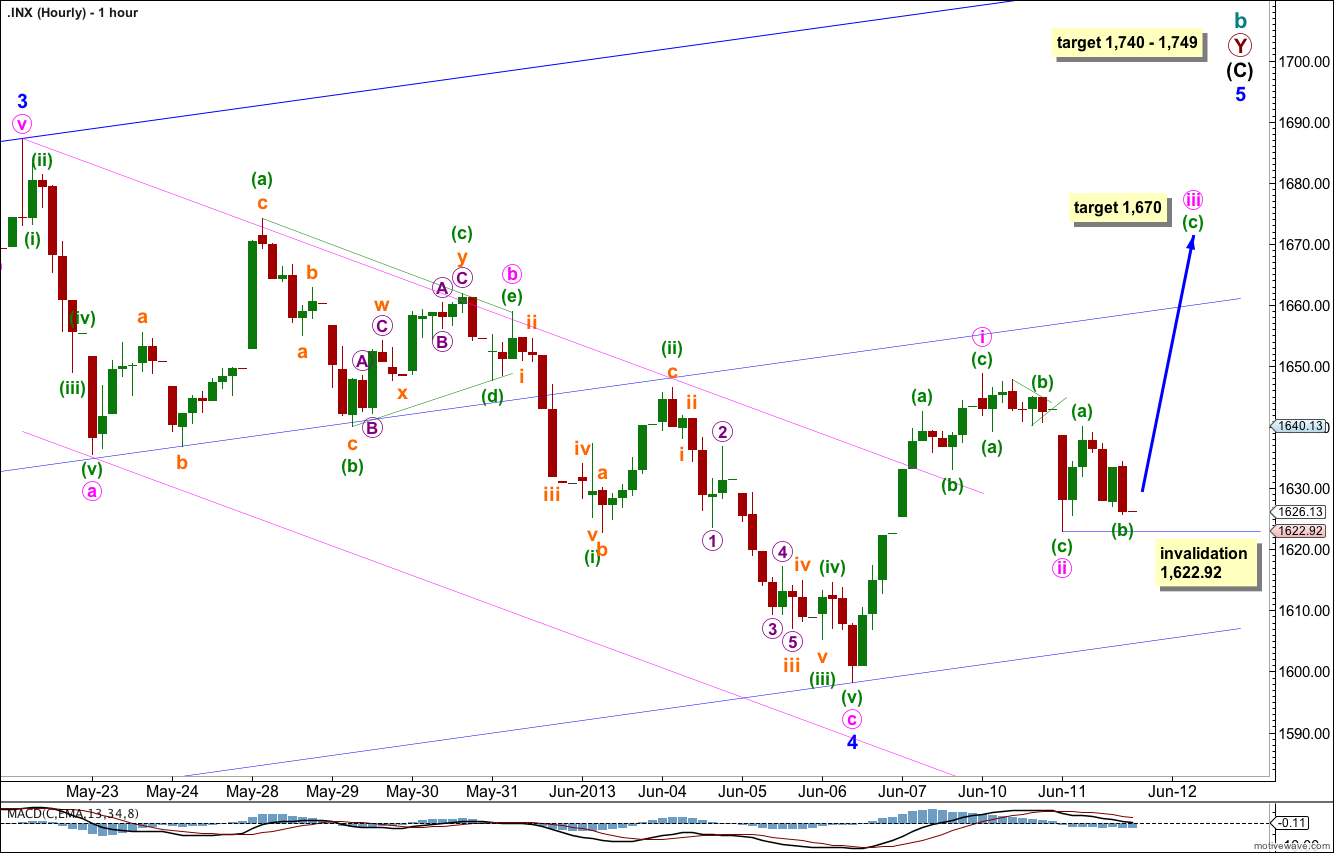
Minor wave 5 looks like it is unfolding as an ending diagonal, so far. Alternatively, this may only be minute wave i as a leading diagonal within minor wave 5 if we move the degree of labeling within movement from the low at 1,598.23 all down one degree. When the diagonal structure is complete I will consider which degree of labeling may be more likely taking into account duration and length.
At this stage we may have the first wave within a diagonal complete. The second wave may be either complete or it may yet move a little lower.
If the second wave is complete then it is just 51% the length of the first wave. This is acceptable but it is shallower than second waves commonly are within diagonals.
Within minute wave ii there is no Fibonacci ratio between minuette waves (a) and (b). Minuette wave (b) subdivides as a triangle on the five minute chart.
On the five minute chart the movement upwards labeled here minuette wave (a) within minute wave iii subdivides most easily as a five wave impulse, and minuette wave (b) downwards subdivides as a zigzag. This wave count has the best fit, and so it is my main wave count.
At 1,670 minuette wave (c) within minute wave iii would reach 2.618 the length of minuette wave (a).
Within minute wave iii minuette wave (b) may not move beyond the start of minuette wave (a). This wave count is invalidated with movement below 1,622.92.
If this wave count is invalidated with downwards movement tomorrow then we should use the alternate below.
Alternate Hourly Wave Count.
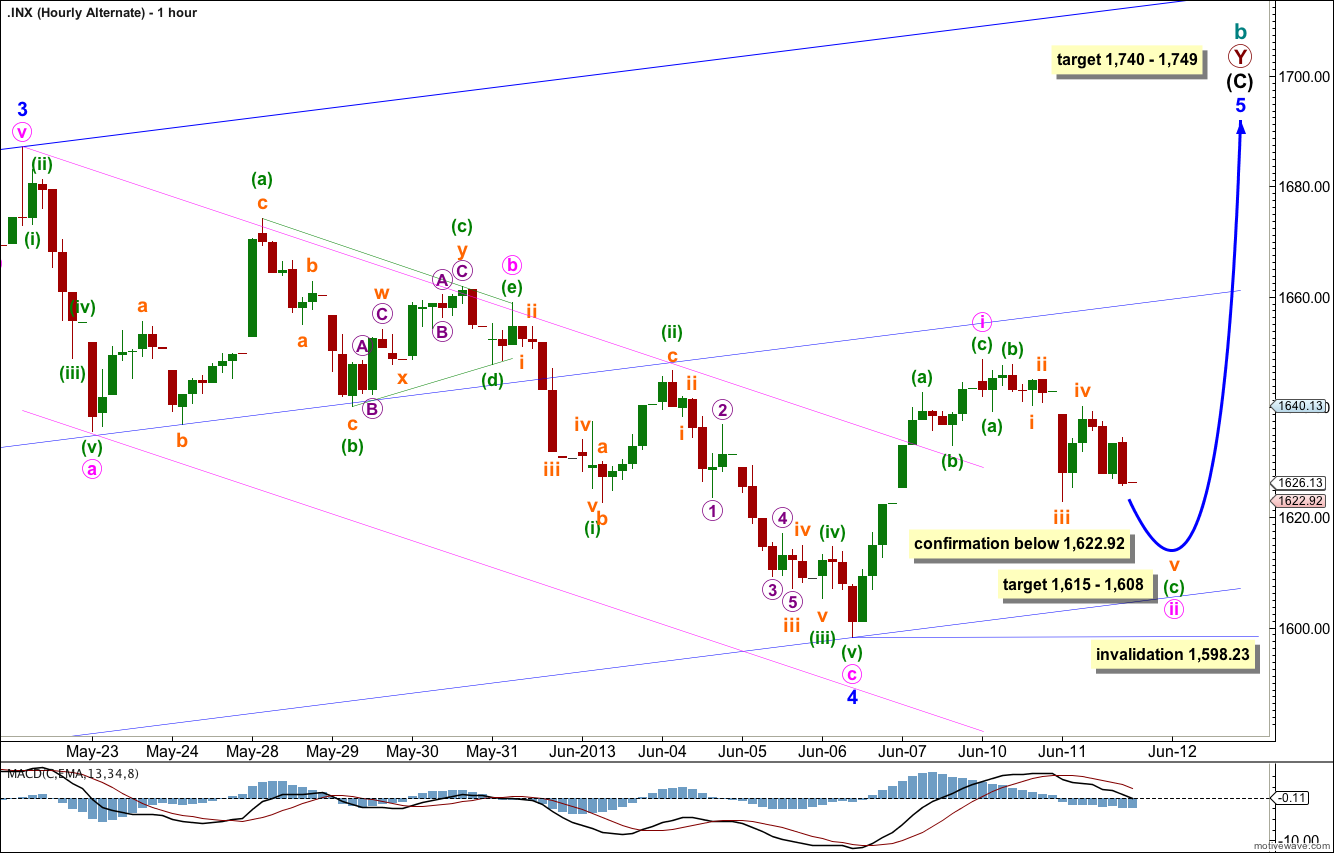
This alternate is the same as the main wave count up to the point labeled minuette wave (a) within minute wave ii.
If minuette wave (b) was a single zigzag and not a triangle then the following downwards movement for minuette wave (c) may be incomplete.
This wave count does not have as good a look as the main wave count. Subminuette wave iv is bigger in duration and size to minuette waves (a) and (b) giving the proportions of this wave count an odd look.
On the five minute chart the upwards movement labeled subminuette wave iv does not subdivide well as a three. The downwards movement labeled subminuette wave v would be an incomplete five.
Because of the low probability for this wave count I would only want to use it if it is confirmed with movement below 1,622.92.
At that stage we may expect it is most likely for minute wave ii to end between 0.66 to 0.81 the length of minute wave i, which is between 1,615 to 1,608.
Minute wave ii may not move beyond the start of minute wave i. This wave count is invalidated with movement below 1,598.23.
Lara,
First of all, thanks for all your great analysis. You continue to gain my respect and admiration for the quality and depth of your analysis.
My question: If minute wave iii (pink) has a target of 1670 will minor wave 5 (blue) ever be able to reach 1740?
Thanks and have a great day,
Rodney
Hi Lara,
why have you labelled minute waves i,ii and iii pink in minor wave 5 as all being 3 waves? Is this because minor 5 is an ending diagonal?
Yes, exactly.
Page 87, Frost and Prechter, “Elliott Wave Principle” (10th edition): “waves 1, 2, 3, 4 and 5 of an ending diagonal… always subdivide into zigzags”.