Yesterday’s analysis expected the S&P 500 to move higher for Wednesday’s session which is not what happened. However, we had a confirmation point and a trend channel which needed to be breached before we could have confidence that the upwards trend had resumed. We did not get this confirmation so this downwards movement, although unexpected, had to be considered as a possibility.
Downwards movement has necessitated a reanalysis of the wave count at the daily chart level.
Click on the charts below to enlarge.
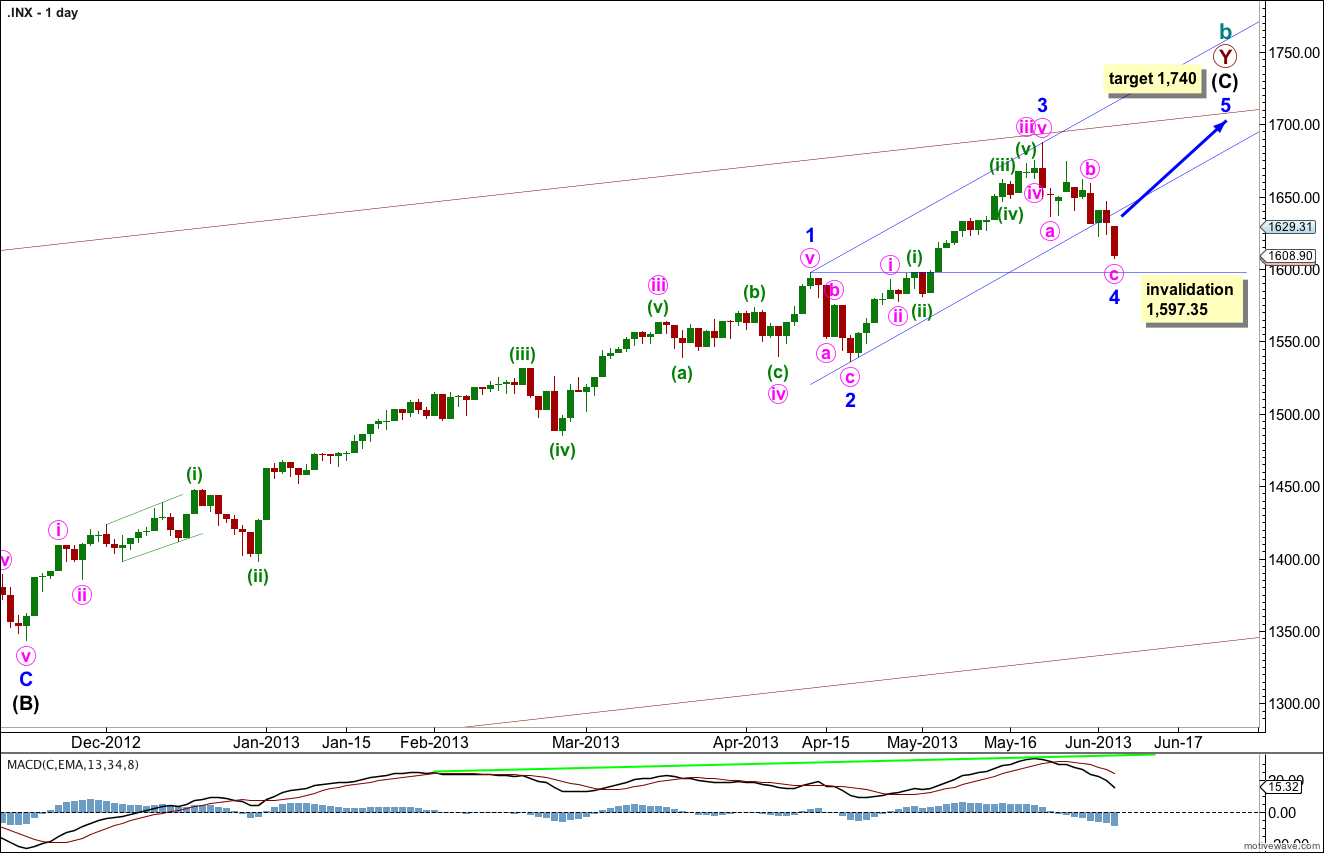
The bigger picture sees upwards movement from the end of the “credit crunch” at 666.76 as a double zigzag structure for a cycle degree b wave lasting so far 4.25 years. The second zigzag is almost complete. When it is done we should see another crash to make substantial new lows below 666.76, if the main monthly wave count is correct. If, however, the next upwards wave sees an increase in momentum beyond that seen for minor wave 3 then the alternate very bullish monthly wave count must be seriously considered. I will be watching momentum carefully over the next few weeks.
Within intermediate wave (C) minor wave 1 was extended.
I have adjusted the wave count to see minor wave 3 as complete at the all time price high. With this labeling minor wave 3 is just 5.82 points short of 0.618 the length of minor wave 1. I would expect the upcoming minor wave 5 to reach equality with minor wave 3 so to be about 150 points in length.
I have checked the subdivisions within minor wave 3 on the hourly chart. Although the middle of it looks a little odd on the daily chart it does have a nice fit on the hourly chart.
Minor wave 3 is shorter than minor wave 1. Minor wave 5 would be limited to no longer than equality with minor wave 3 because a third wave may never be the shortest.
At 1,740 intermediate wave (C) would reach equality with the orthodox length of intermediate wave (A).
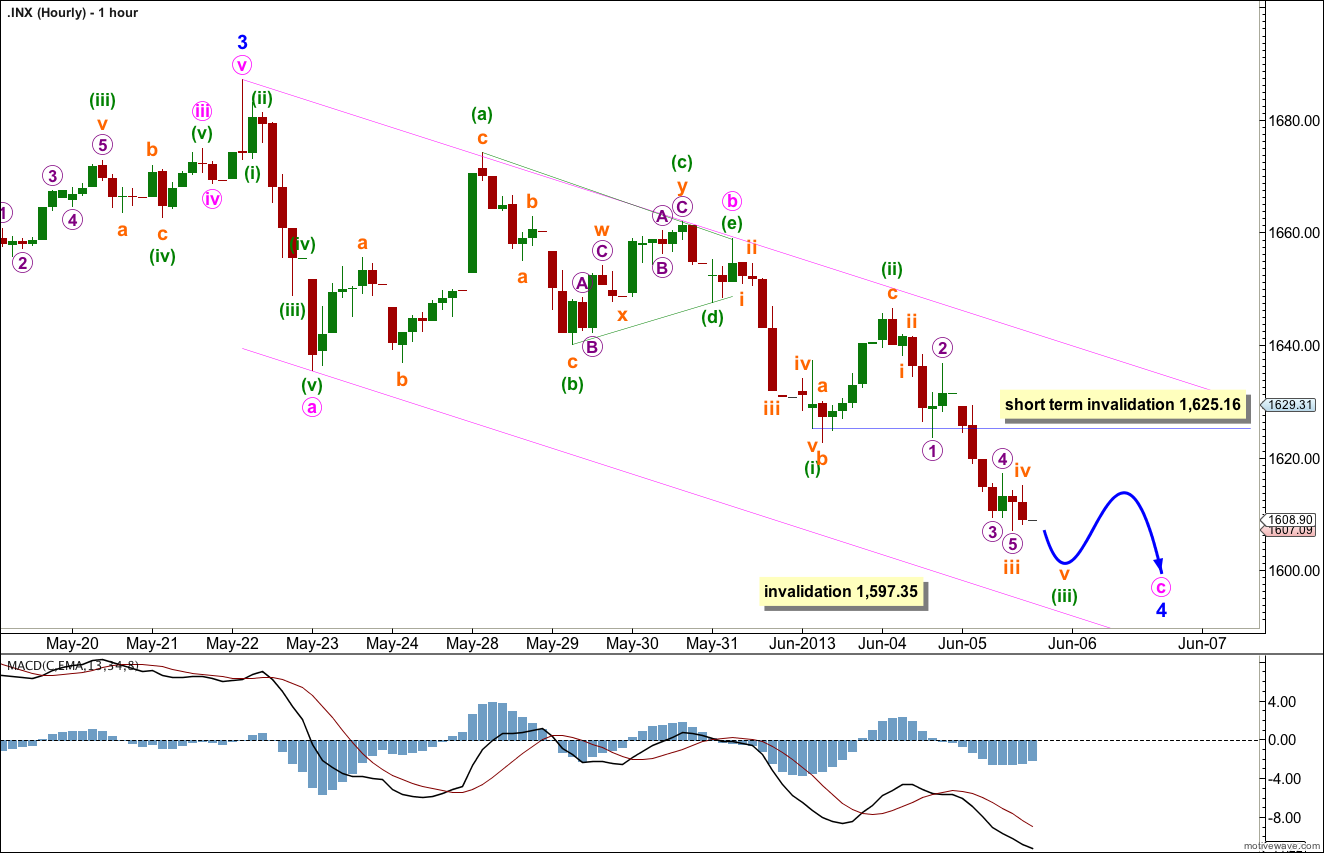
Minor wave 4 may be unfolding as a single zigzag with minute wave b within it a completed triangle. Minute wave c downwards is incomplete. This has a better fit than a double combination, because the purpose of a combination is to take up time and move price sideways. That is not what is happening here as price is clearly moving lower.
Minor wave 4 may not move into minor wave 1 price territory. This wave count is invalidated with movement below 1,597.35.
So far minor wave 4 has breached Elliott’s channel about the impulse of intermediate wave (C). Sometimes fourth waves do this. When they do we redraw the channel using Elliott’s second technique when the fourth wave is completed.
The very wide maroon trend channel shown here is copied over from the monthly chart. We may find this movement ends as it finds resistance at the upper trend line.
When we see minor wave 3 as complete at the price high it has a great Fibonacci ratio to minor wave 1.
This then leaves minor wave 4 beginning at 1,687.18 so it looks best as a single zigzag.
Within it minute wave b triangle has a good look; minuette wave (b) was 88% the length of minuette wave (a), minuette wave (c) was 63% of minuette wave (b), minuette wave (d) was 66% of minuette wave (c), and minuette wave (e) ended exactly at the A-C trend line and was 80% of minuette wave (d). Triangle waves of between 61.8% to about 85% are typical.
If we extend the triangle trend lines outwards then the point in time at which they cross over is EXACTLY the point in time at which a trend change was seen.
For these reasons I am happy with this piece of the wave count.
If minute wave b was a triangle then minute wave c begins at 1,658.99 and must unfold as a five wave structure. So far this is incomplete.
We have seen an increase in momentum downwards over the last two sessions, this fits with this new wave count as minuette wave (iii) within minute wave c.
Minuette wave (iv) is yet to unfold. It may not move into minuette wave (i) price territory. This wave count is invalidated in the short term with movement above 1,625.16.
Minor wave 4 is so far showing nice alternation with minor wave 2: minor wave 2 was a shallow 24% zigzag and its B wave was a small zigzag while minor wave 4 is a relatively deep zigzag with a triangle as its B wave.
I expect we may have choppy, overlapping downwards movement with a decrease in momentum for another one or two sessions before minor wave 4 is over. It may get extremely close to the high of minor wave 1, testing our nerves and patience. It is only movement BELOW 1,597.35 which would invalidate this wave count.
If this wave count is invalidated with downwards movement then I would consider the (very unlikely) possibility that cycle wave b may be over and we may have seen a cycle degree trend change three or so weeks earlier than expected.


Wave (iii) green pushing into your 1597.57 not a lot of room for Wave (v)
http://scharts.co/11HvIiI
NYMO will close in the GREEN today
if the SPX close RED = our bullish divergence we need for the ride to 1750 // I hope your current count holds
Holding…. so far
We need to see confirmation of the resumption of the upwards trend before we can have confidence in it though…