
Yesterday’s analysis expected upwards movement. This is not what happened. Price moved lower, but in failing to make a new low the wave count remains valid and will be the same.
The targets are unchanged and I have still just the one daily and one hourly wave count for you.
Click on the charts below to enlarge.
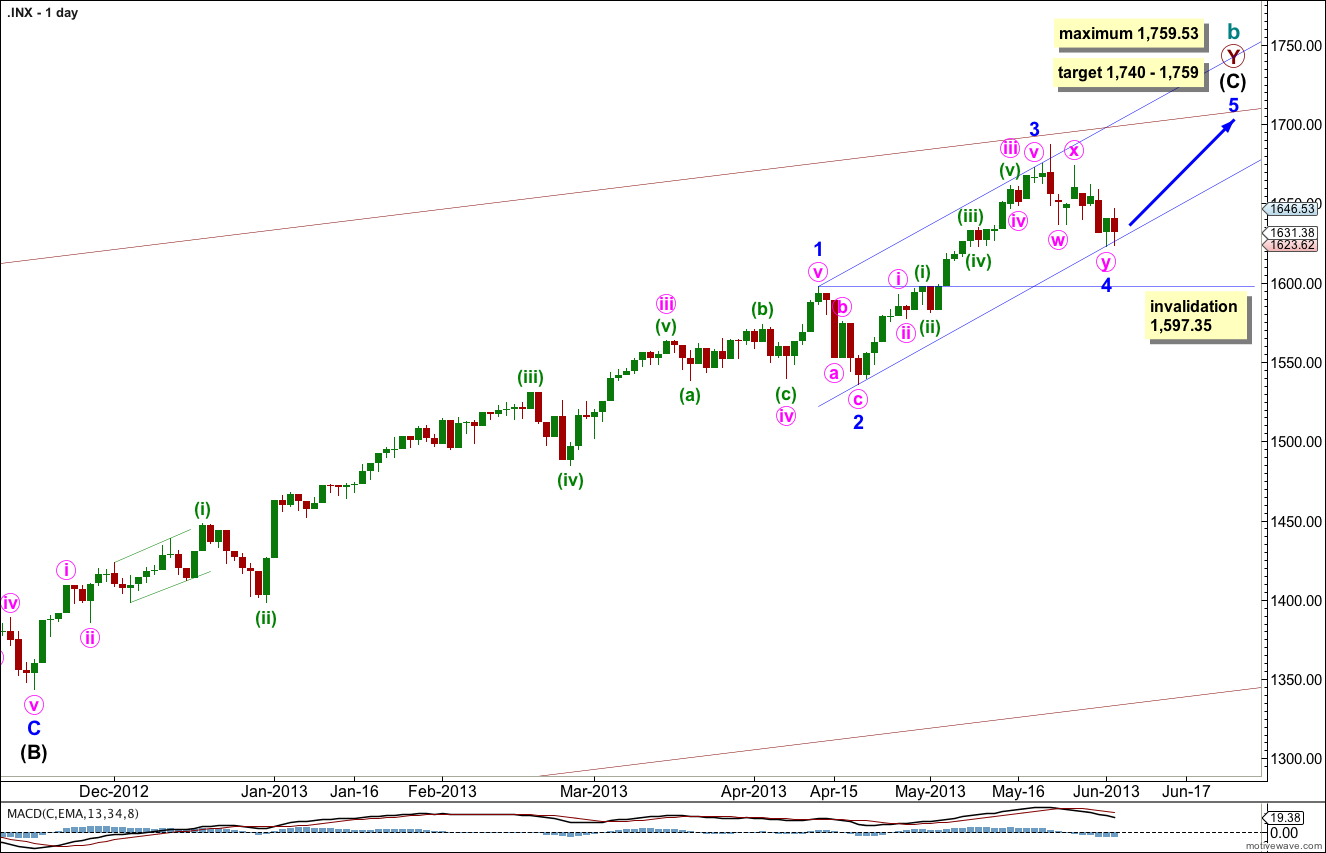
The bigger picture sees upwards movement from the end of the “credit crunch” at 666.76 as a double zigzag structure for a cycle degree b wave lasting so far 4.25 years. The second zigzag is almost complete. When it is done we should see another crash to make substantial new lows below 666.76, if the main monthly wave count is correct. If, however, the next upwards wave sees an increase in momentum beyond that seen for minor wave 3 then the alternate very bullish monthly wave count must be seriously considered. I will be watching momentum carefully over the next few weeks.
Within intermediate wave (C) minor wave 1 was extended.
There is no Fibonacci ratio between minor waves 3 and 1. This means it is highly likely we should see a Fibonacci ratio between minor wave 5 and either of 3 or 1.
Minor wave 3 is shorter than minor wave 1. Minor wave 5 would be limited to no longer than equality with minor wave 3 because a third wave may never be the shortest. Minor wave 5 is limited to no higher than 1,759.53
At 1,740 intermediate wave (C) would reach equality with the orthodox length of intermediate wave (A). At 1,759 minor wave 5 would reach equality in length with minor wave 3. I favour the higher end of this target zone because it is calculated at a lower wave degree.
Minor wave 4 may not move into minor wave 1 price territory. This wave count is invalidated with movement below 1,597.35.
Draw the parallel channel about intermediate wave (C) using Elliott’s first technique. Draw the first trend line from the highs of minor waves 1 to 3, then place a parallel copy upon the low of minor wave 2. Expect minor wave 4 to find support at the lower edge of this channel. The following fifth wave may end midway in the channel where it intersects with the upper maroon trend line.
The very wide maroon trend channel shown here is copied over from the monthly chart. We may find this movement ends as it finds resistance at the upper trend line.
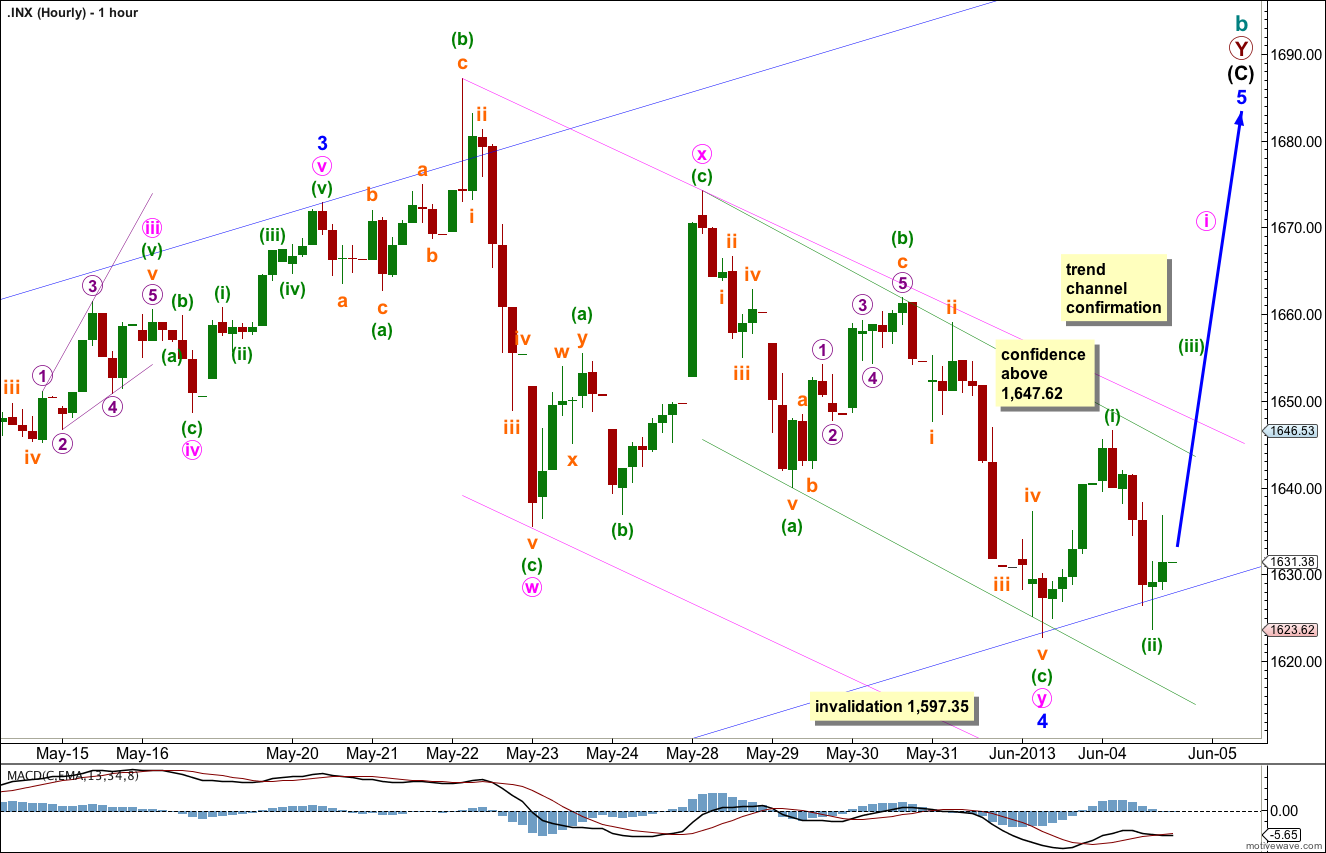
Movement for Tuesday’s session subdivides on the five minute chart as a nice five wave impulse for minuette wave (i), and a zigzag for minuette wave (ii).
The key to determining if we have seen a trend change at 1,622.72, the low labeled minor wave 4, is the downwards movement for Tuedsay’s session labeled minuette wave (ii). If this is a three wave structure then the new trend is upwards. If this is a five wave structure then the trend remains down. I have looked carefully at the subdivisions of this movement on the one minute chart today. It is a little ambiguous, it can be seen as either a three or a five. But as a three it has a better fit. It is more likely then that the trend has changed back to upwards.
Until we see movement above 1,647.62 we must accept the possibility that minor wave 4 may not be over and may continue yet further sideways.
If this analysis is correct then we should see a little increase in momentum tomorrow as mineutte wave (iii) within minute wave i unfolds upwards. Minuette wave (iii) must move beyond the end of minuette wave (i) so must make a new high above 1,646.53; it should provide us with confirmation tomorrow.
Thereafter, movement above both the green and pink parallel channels containing minute wave y and minor wave 4 will provide us with further confidence that we have seen the resumption of the upwards trend.
While we do not have this confirmation the invalidation point must remain the same. Minor wave 4 may not move into minor wave 1 price territory. This wave count is invalidated with movement below 1,597.35.
Agreed … // Do you have a wave count if we push 20 points under 1597.57
I’ll answer this question in todays video.
Could this drop into Wave [A] = 1615.43 be a part of a http://thepatternsite.com/at.html and Wave [B] we push all the way back up again?
EMA(34) will have to HOLD // push back over now … took some gain on my two day short
No. This is trending down, not upwards?
The EW equivalent would be a diagonal. This is not a diagonal.
As long as price does not move below 1,597.35 the wave count will remain valid. This is an extension of minor wave 4 downwards, and this is why I provide confidence points and trend channels. This was unexpected, but I did warn that it could happen while we did not have confirmation that the main upwards trend had resumed.