
Last analysis expected downwards movement for Friday’s session to a short term target at 1,628. Price moved lower as expected, falling short of the target by just 2.74 points.
The wave count remains the same.
Click on the charts below to enlarge.
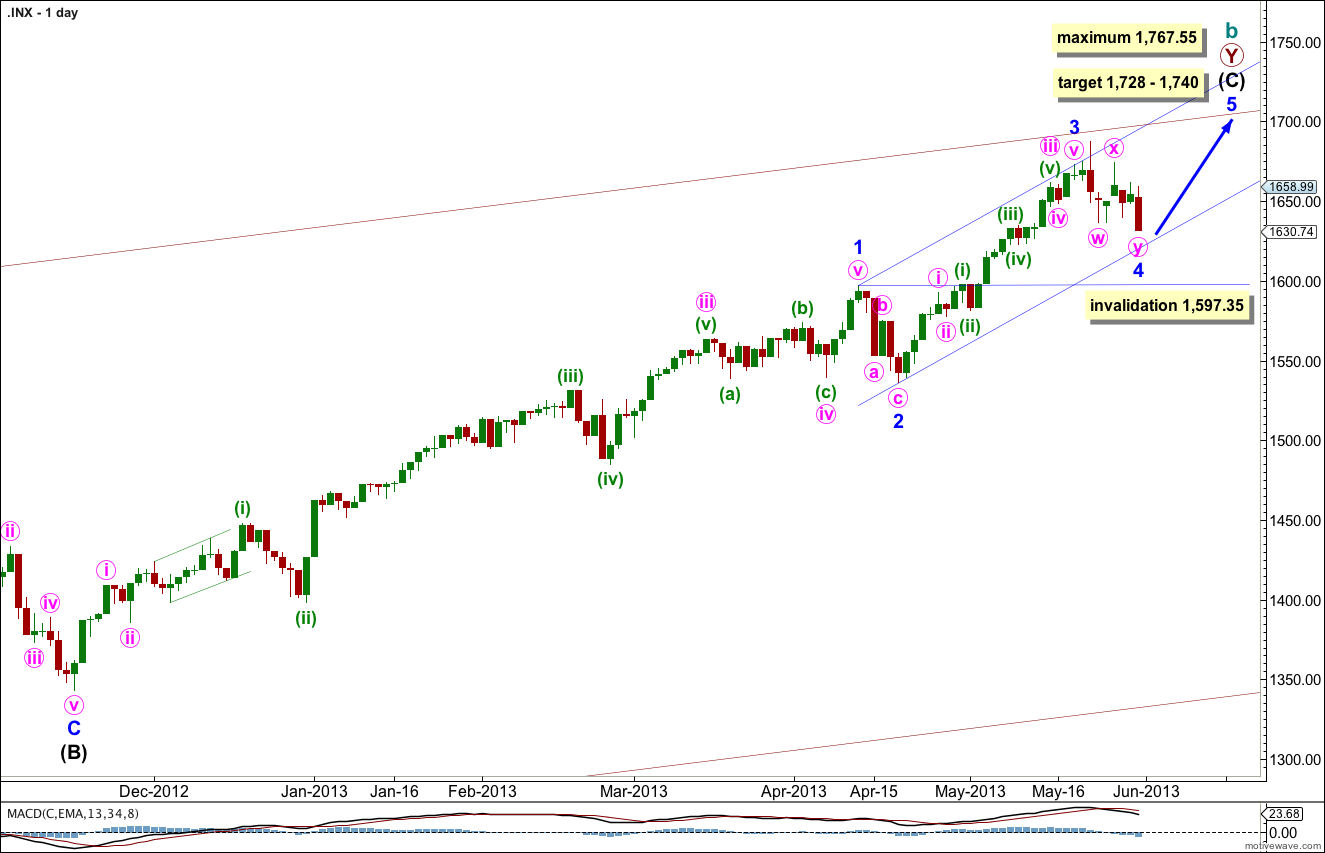
Within intermediate wave (C) minor wave 1 was extended.
There is no Fibonacci ratio between minor waves 3 and 1. This means it is highly likely we should see a Fibonacci ratio between minor wave 5 and either of 3 or 1.
Minor wave 3 is shorter than minor wave 1. Minor wave 5 would be limited to no longer than equality with minor wave 3 because a third wave may never be the shortest. If minor wave 4 has ended at 1,630.74 and does not move lower then minor wave 5 is limited to no higher than 1,767.55.
At 1,740 intermediate wave (C) would reach equality with the orthodox length of intermediate wave (A). At 1,728 minor wave 5 would reach 0.382 the length of minor wave 1. I favour the lower end of this target zone because it is calculated at a lower wave degree.
Minor wave 4 may not move into minor wave 1 price territory. This wave count is invalidated with movement below 1,597.35.
Draw the parallel channel about intermediate wave (C) using Elliott’s first technique. Draw the first trend line from the highs of minor waves 1 to 3, then place a parallel copy upon the low of minor wave 2. Expect minor wave 4 to find support at the lower edge of this channel. The following fifth wave may end midway in the channel where it intersects with the upper maroon trend line.
The very wide maroon trend channel shown here is copied over from the monthly chart. We may find this movement ends as it finds resistance at the upper trend line.
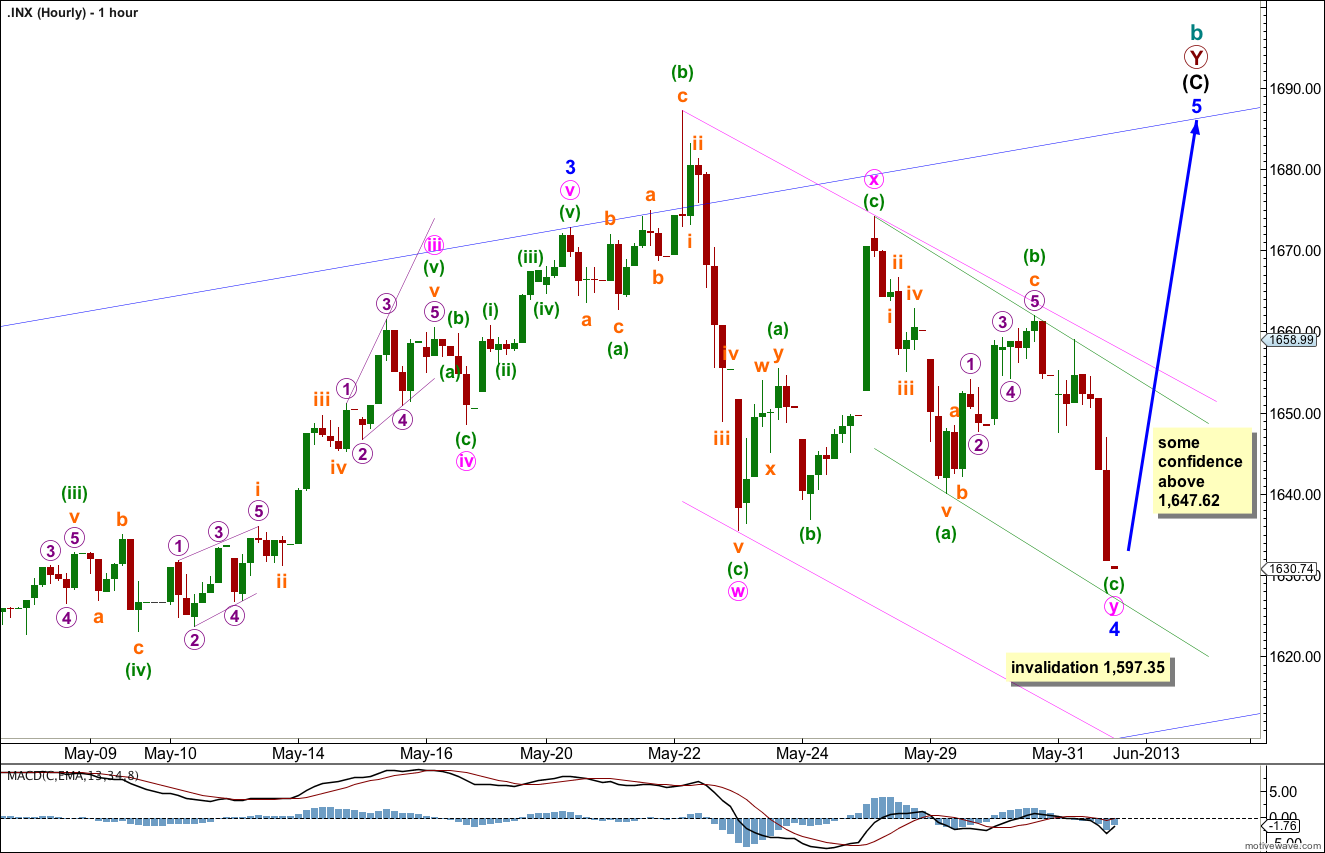
At this stage it is possible that minor wave 4 is over in a Fibonacci 8 days, but there is not enough upwards movement at the end of Friday’s session (there is none) to confirm that the final fifth wave within minuette wave (c) is complete.
Movement above 1,647.62 would indicate that minuette wave (c) should be over as at that stage upwards movement may not be a fourth wave correction within it.
Movement above the green channel containing minute wave y zigzag would provide trend channel confirmation that minute wave y is over and the next wave upwards is underway.
There will exist a slim outlying possibility that minor wave 4 could continue further sideways as a triple. However, the probability is very low for two main reasons: triples are very rare structures, and a further continuation of minor wave 4 would see it much longer in duration than minor wave 2 giving the wave count an odd look.
What does have a higher probability is that minuette wave (c) may be incomplete and it may move a little lower on Monday. If it did I would expect it to move to about 1,628 and find support at the lower end of the green parallel channel about minute wave y. If it were to break through that line of support the next support is at the lower edge of the wider blue channel copied over here from the daily chart.
On the five minute chart the structure of minuette wave (c) can be seen as a complete five wave impulse, although it does look like a three on the hourly chart. Within it subminuette waves ii and iv are out of proportion (not such a problem on the five minute chart) which may give this possible five wave structure a three wave look. It is possible that downwards movement is over if minor wave 4 is to last only a Fibonacci eight days.
Within minute wave y zigzag minuette waves (a) and (c) are just 2.99 off equality.
If minor wave 4 moves any lower on Monday it may not move into minor wave 1 price territory. This wave count is invalidated with movement below 1,597.35.
Extra.
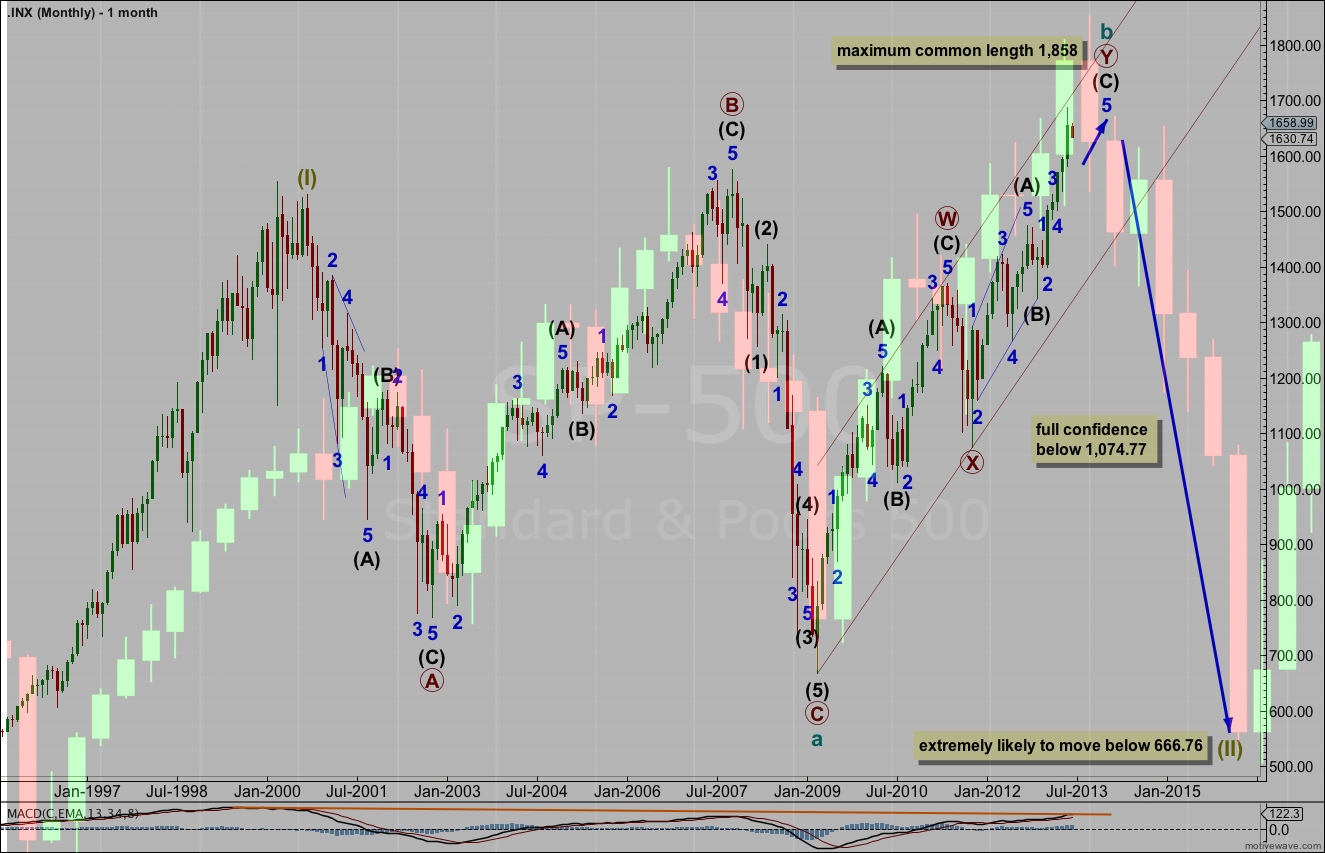
To end this trading week I have an extra chart for your consideration. Cesar does a lot of work comparing charts of different instruments, and time frames within the same instrument. This chart below is an overlay of the S&P 500 current monthly chart with a similar period from the early 1970’s recession. The foreground is quarterly candlesticks from the 1970’s, the background is the current monthly wave count for the S&P 500.
So far they match up perfectly. If this current pattern continues to follow what happened in the 1970’s then we should be looking out for another big crash, this one to reach lower than the credit crunch. This is exactly what the current main wave count calls for.
EMA(34) not holding // looks like your 1,597.35 is not going to last long and we could text 1550.00 area
That just does not fit with the wave count.
I do expect we shall see price move below 1,550, yes, but not before minor wave 5 upwards is complete.
Looks like we must have a triple correction because the expanding Triangle need a drop just under 1597.57 http://scharts.co/ZENHvX
Nice looking fractal relationship with the 70’s. One more quarter in it if it plays out to the same timeframes.
In relation to Friday’s SPX chart, it is hard for me to see the completed 5 waves down for minute C. They are there but for me the 5 waves are not of the same degree and therefore more to go on this C wave. Maybe it goes down to 1.618 extension of A for C to bring it down to 1590 but that is out of proportion with your count. Time will tell!
Mangawhai looks very nice. You are on the same latitude as Sydney so would have thought it was warm, but I guess I am not hitting the ocean in the winter time like you are. Got to get over to NZ one of these days. It looks great!
Not sure how much longer it will last, the quarterly candlesticks are not the clearest.
For the Dow I was able to find monthly candlesticks and the relationship can then be seen much more clearly.
Either way, we’re almost at the end of this upwards trend, if this relationship holds.
I’ll open up this week’s Dow analysis to SPX only members so you can all see that chart.
Looks like you were correct and that wave 5 up seems to be now underway. I was thinking the greatest momentum in the final thrust down had to have been the wave 3 of the zigzag but seems the wave 5 as well. Well done Lara!
Thanks!
That last little downwards bit of movement makes the C wave a perfect five now. Looks great.
I’m actually really happy with how I managed the analysis of this fourth wave. Corrections are so tricky to get right!
Now we just need a five up, channel breach and movement above 1,647.62 to confirm it’s over.
Hi Lara, Nice shot of Mangawhai sand hills?
regards,
Gary Ferguson
Yes! That’s where I live 🙂 Paradise it is!
Although it could be a bit warmer at the moment… the water gets cold in winter which makes my head sore when I surf.
Very interesting Lara.
I think you mean the charts are the other way around-the 1970’s chart is in the background?
ummm…. kinda hard to say really which is foreground and which is background…
the way it was done in photoshop used my monthly chart as the background
but it doesn’t matter really
for the SPX I was unable to find data with monthly candlesticks way back in the 60’s so these are quarterly. It does not show up the nice correlation, particularly within this last upwards movement labeled cycle wave b.
the dow will show that better, I was able to find monthly candlesticks for that