
Last analysis expected to see downwards movement after the channel drawn on the hourly chart was breached. The channel was breached, but thereafter price moved to a new high as a fourth wave correction continued deeper.
This week the structure of this fourth wave is much clearer and a channel drawn around it shows nicely where price has found support and resistance. The last two days of downwards movement may be the start of the next wave down.
Click on the charts below to enlarge.
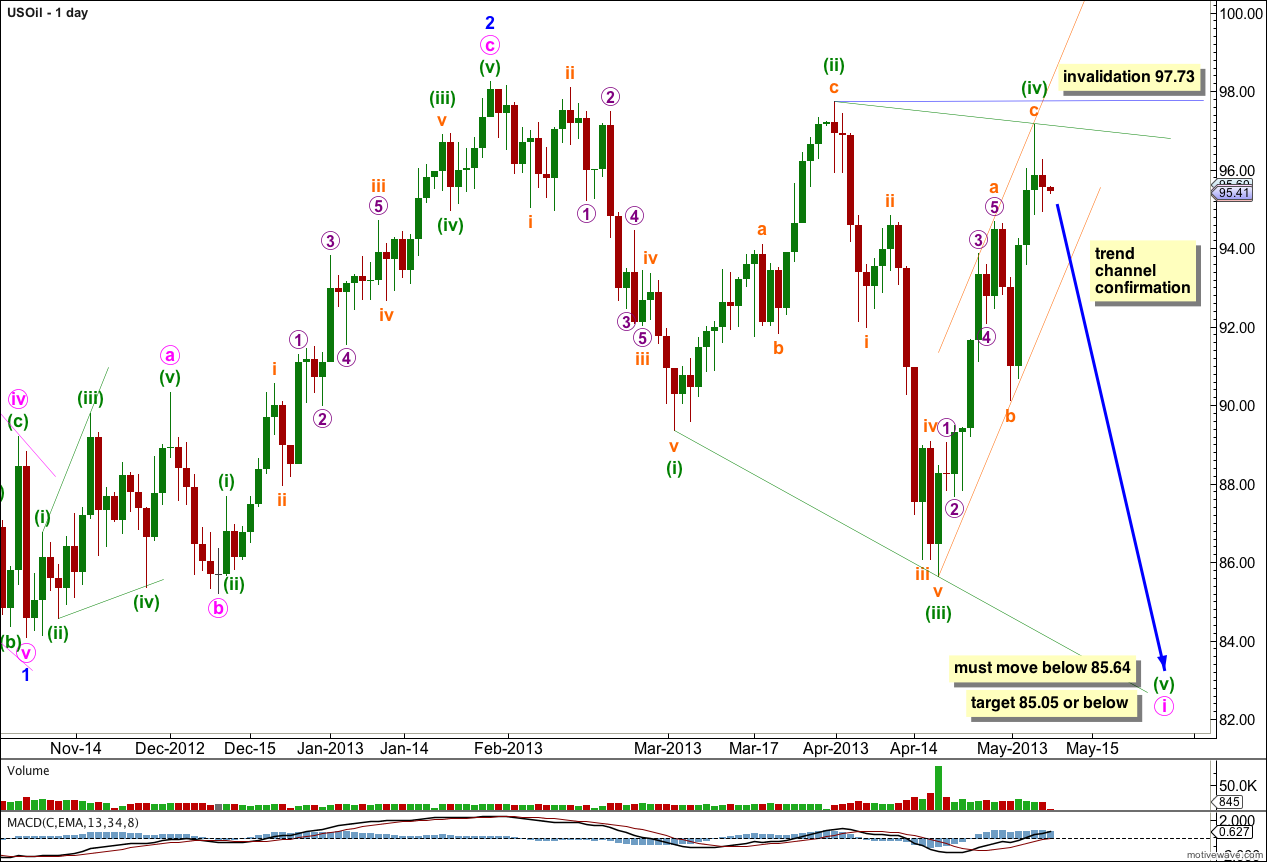
This wave count sees US Oil in a third wave downwards at intermediate degree, within a primary wave C down.
Within intermediate wave (3) minor waves 1 and 2 are complete.
Within minor wave 3 minute wave i may be unfolding as a leading diagonal. Within the leading diagonal minuette waves (ii) and (iv) must subdivide into zigzags, and minuette waves (i), (iii), and (v) are usually zigzags but may also subdivide as impulses. Second and fourth waves of diagonals are usually deep corrections, between 66% to 81%. Minuette wave (ii) is deeper at 94% and minuette wave (iv) is now 95%.
Within the leading diagonal minuette wave (v) may not be truncated, it must move below 85.64.
The diagonal is expanding. We should expect minuette wave (v) to be longer than minuette wave (iii) so to move below 85.05. However, I have seen diagonals where the third wave is still the longest, so this may not happen.
Draw a parallel channel about minuette wave (iv) using Elliott’s channeling technique. Draw the first trend line from the start of minuette wave (iv) to the low of subminuette wave b within it, then place a parallel copy upon the high of subminuette wave a within minuette wave (iv). We need to see this parallel channel clearly breached by downwards movement before we may have confidence the correction is over and a fifth wave down has begun.
Minuette wave (iv) of the diagonal should overlap into minuette wave (i) price territory, but may not move beyond the start of minuette wave (ii) price territory. This wave count is invalidated with movement above 97.73.
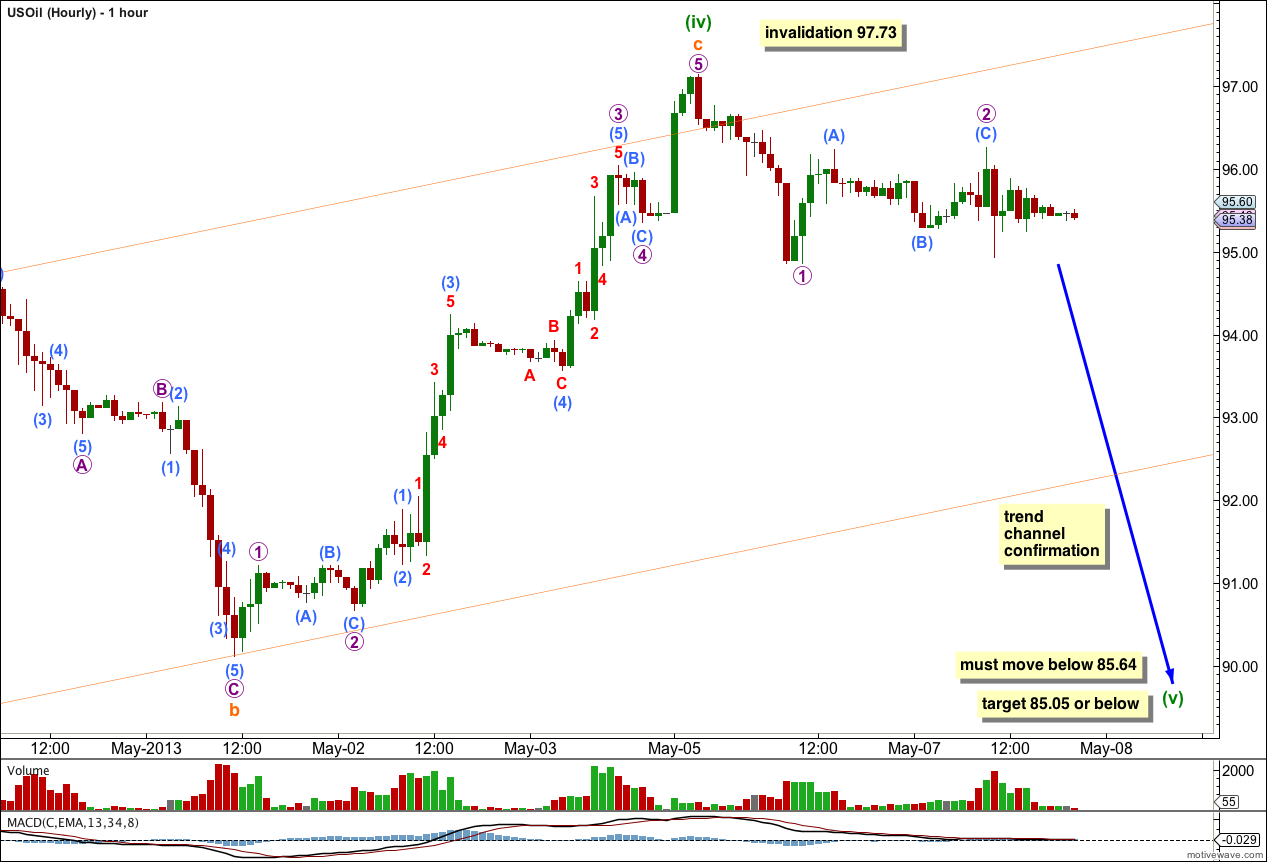
The hourly chart shows the structure within subminuette wave c of minuette wave (iv).
There is no Fibonacci ratio between subminuette waves a and c.
Ratios within subminuette wave c are: micro wave 3 has no Fibonacci ratio to micro wave 1, and micro wave 5 is just 0.03 longer than 1.618 the length of micro wave 1.
Ratios within micro wave 3 are: submicro wave (3) is 0.18 short of 2.618 the length of submicro wave (3), and submicro wave (5) has no Fibonacci ratio to either of submicro waves (1) or (3).
Ratios within submicro wave (3) of micro wave 3 are: nano wave 3 is 0.03 short of 2.618 the length of nano wave 1, and nano wave 5 is 0.07 longer than 1.618 the length of nano wave 1 and 0.09 longer than 0.618 the length of nano wave 3.
Within submicro wave (5) of micro wave 3 there are no adequate Fibonacci ratios between nano waves 1, 3 and 5.
Price remains well within the parallel channel containing minuette wave (iv) zigzag and so we have no confirmation at this stage that the correction is over and minuette wave (v) downwards is underway. Until there is trend channel confirmation of this change I will allow for further upwards movement for minuette wave (iv) and so will leave the invalidation point at 97.73.
Very nice analysis. Decent percentage move as well! Seems to me oil, gold and probably Shanghai composite going down in tandem.