
Yesterday’s analysis again expected upwards movement from both hourly wave counts which is what happened. The main wave count expected momentum to decrease which is also what happened.
With price remaining below the invalidation point on the alternate wave count both wave counts remain valid.
Click on the charts below to enlarge.
Main Wave Count.
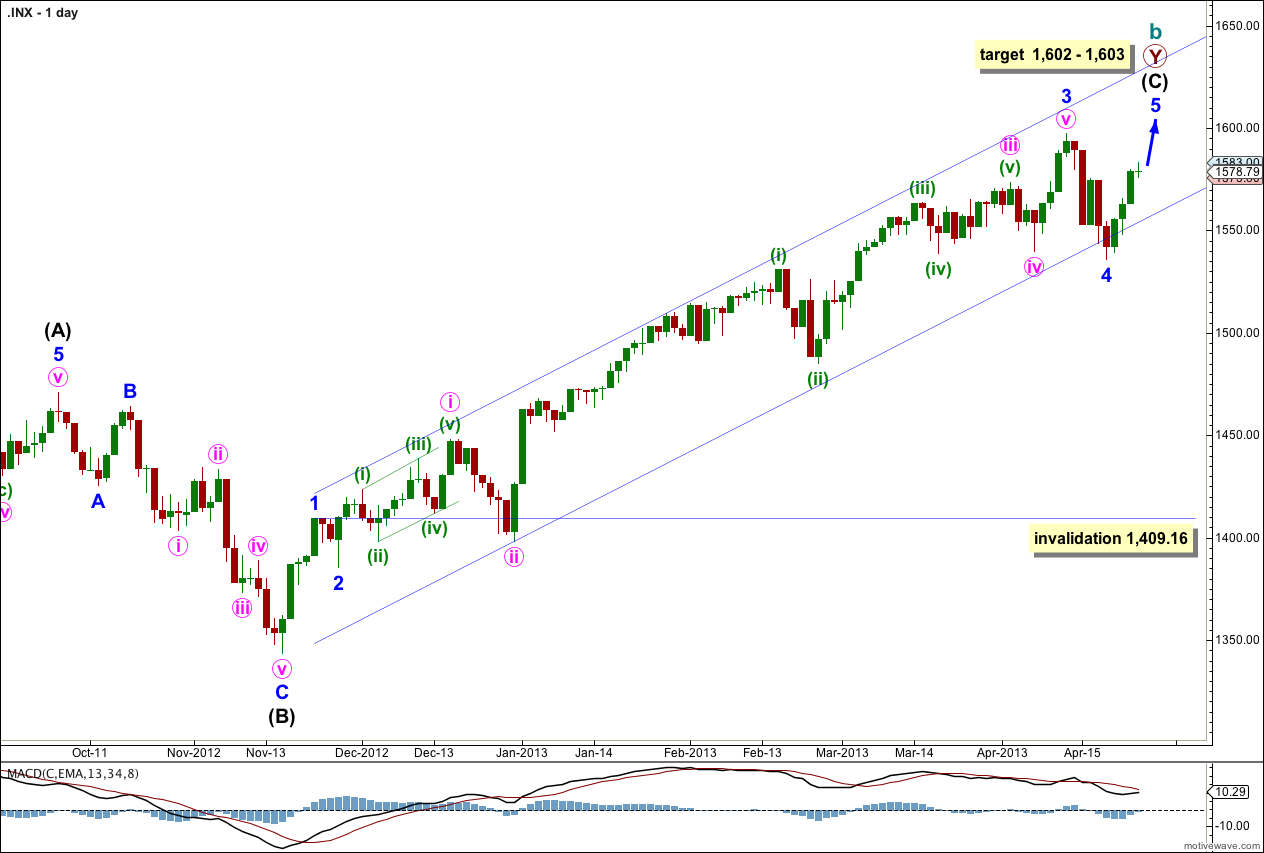
This is my main wave count because we should always assume the trend remains the same, until proven otherwise. We do not have sufficient confirmation of a trend change so we should assume we shall see more upwards movement.
Although the alternate wave count has a channel breach this main wave count does not. The channel is only overshot. I want to see a clear channel breach of this channel also before I have confidence in a trend change.
The channel drawn here is a conservative best fit. Draw the first trend line from the highs of minor waves 1 to 3 and push it upwards to enclose all upwards movement. Place a parallel copy upon the low of minute wave ii within minor wave 3. Minor wave 4 should find some support about the lower edge of this channel.
Minor wave 4 may now be complete; it subdivides into a three on the hourly chart. Alternatively, we may move the degree of labeling within it down one degree and only minute wave a within minor wave 4 may have completed. I expect it is most likely to be complete because it is in proportion to other corrections within intermediate wave (C) and it has lasted a Fibonacci 5 days.
There is no Fibonacci ratio between minor waves 1 and 3. This means it is more likely we shall see a Fibonacci ratio between minor wave 5 and either of 1 or 3. At 1,603 minor wave 5 would reach equality with minor wave 1. This is the most likely Fibonacci relationship for minor wave 5 so this target has a good probability.
At 1,602 minute wave v within minor wave 5 (seen on the hourly chart) would reach 1.618 the length of minute wave i.
If minor wave 5 continues for another four days it would have totaled a Fibonacci eight days. It may continue further for another five days to total a Fibonacci thirteen. Please note: Fibonacci time relationships are not as reliable as price. This expectation is a rough guideline, something to look out for, but should not be relied upon.
If it continues further minor wave 4 may not move into minor wave 1 price territory. This wave count is invalidated with movement below 1,409.16.
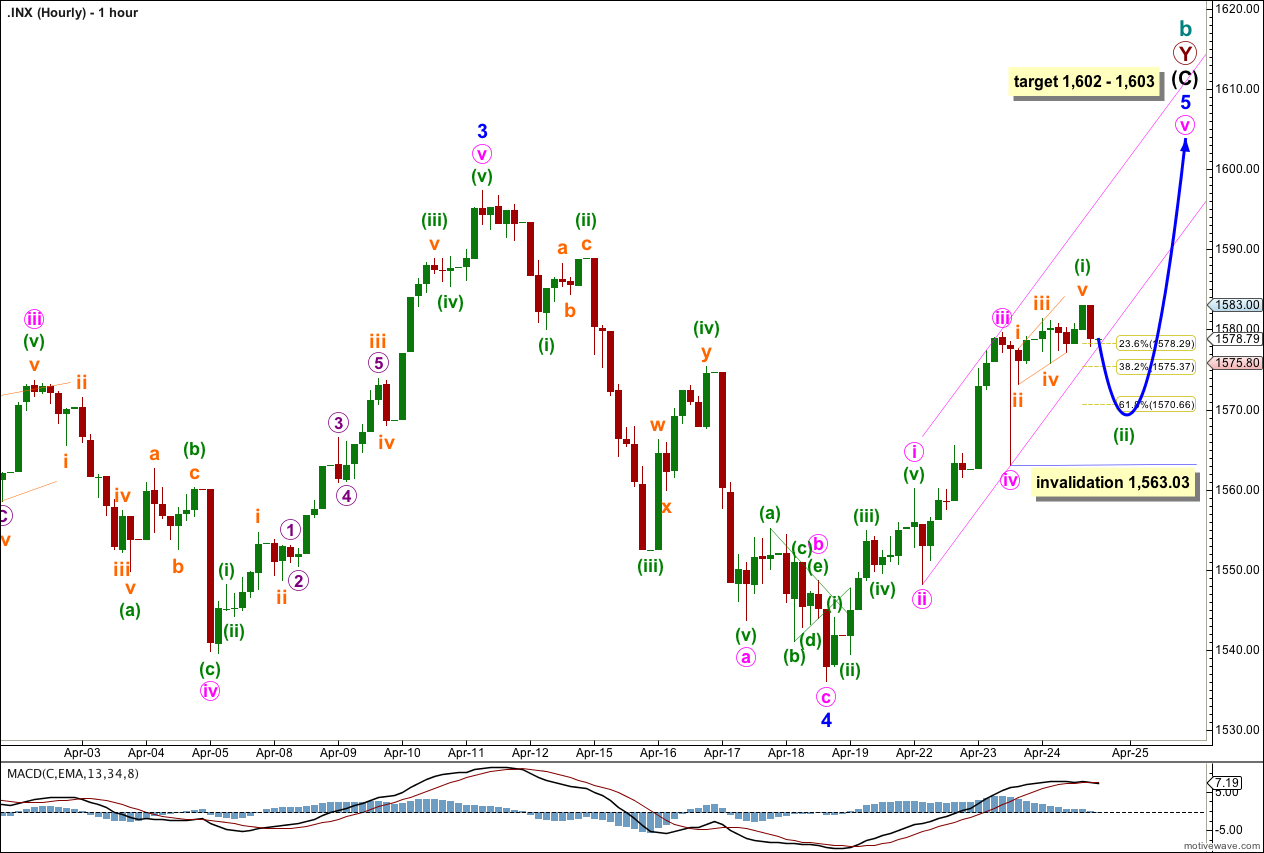
Wednesday’s movement subdivides nicely on the five minute chart as a diagonal. This may be a leading diagonal for minuette wave (i).
Following a leading diagonal in a first wave position we should expect to see a deep second wave correction. I expect tomorrow to most likely open with downwards movement. I would expect minuette wave (ii) to reach to the 0.618 Fibonacci ratio of minuette wave (i) at 1,570.66 or below. It should be over during tomorrow’s session. When it is done price should turn back upwards with some increase in momentum for a minuette degree third wave.
Minuette wave (ii) may breach the parallel channel drawn here containing minor wave 5. If it does we shall redraw the channel using a best fit. To see how this may play out see the main daily chart: minute wave ii within minor wave 3 breached the channel as we had drawn it at that time, and this deep correction means that drawing the channel for the entirety of intermediate wave (C) is difficult and must be done as a best fit, not using Elliott’s techniques.
Minuette wave (ii) may not move beyond the start of minuette wave (i). This wave count is invalidated at minute degree with movement below 1,563.03.
If this wave count is invalidated with downwards movement then I would move the degree of labeling within minor wave 5 all down one degree. Downwards movement could then be a second wave correction for minute wave ii which may not move beyond the start of minute wave i at 1,536.03.
Alternate Wave Count.
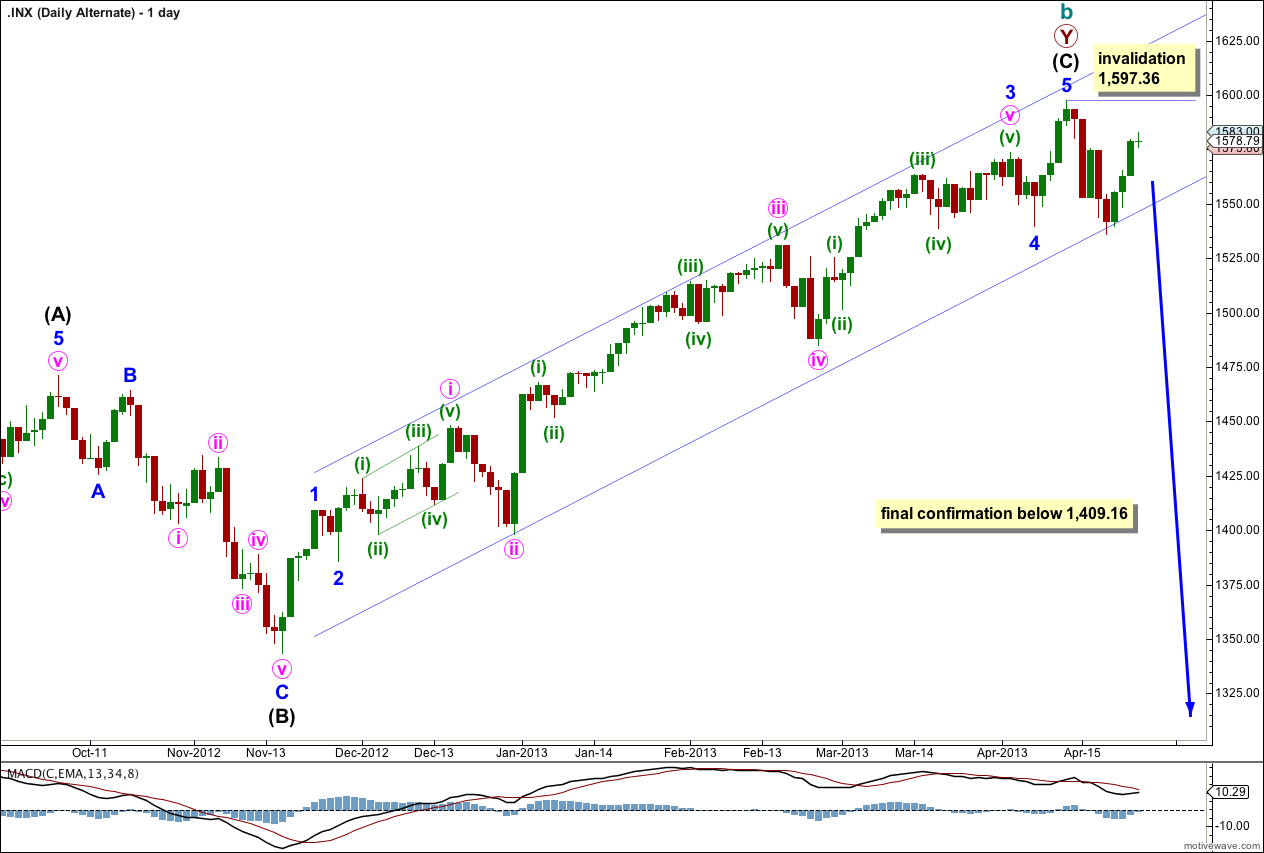
It is again possible that we have seen a trend change, but at this stage we do not have enough confirmation. There is a hanging man candlestick pattern, but this is an indicator only and not a reversal pattern.
This wave count agrees with MACD as an indicator of momentum. The strongest piece of movement is minuette wave (iii) within minute wave iii within minor wave 3, the very middle of the third wave.
I have redrawn the channel today to be the same as on the main daily wave count. I want to see a clear channel breach, with the most conservatively drawn channel (as this one is) before I have any confidence whatsoever in a possible trend change.
Final confirmation would come with invalidation of the main wave count with price movement below 1,409.16. At that stage we may have confidence that the S&P 500 should be in a new downwards trend to last one to several years and take price substantially below 666.76.
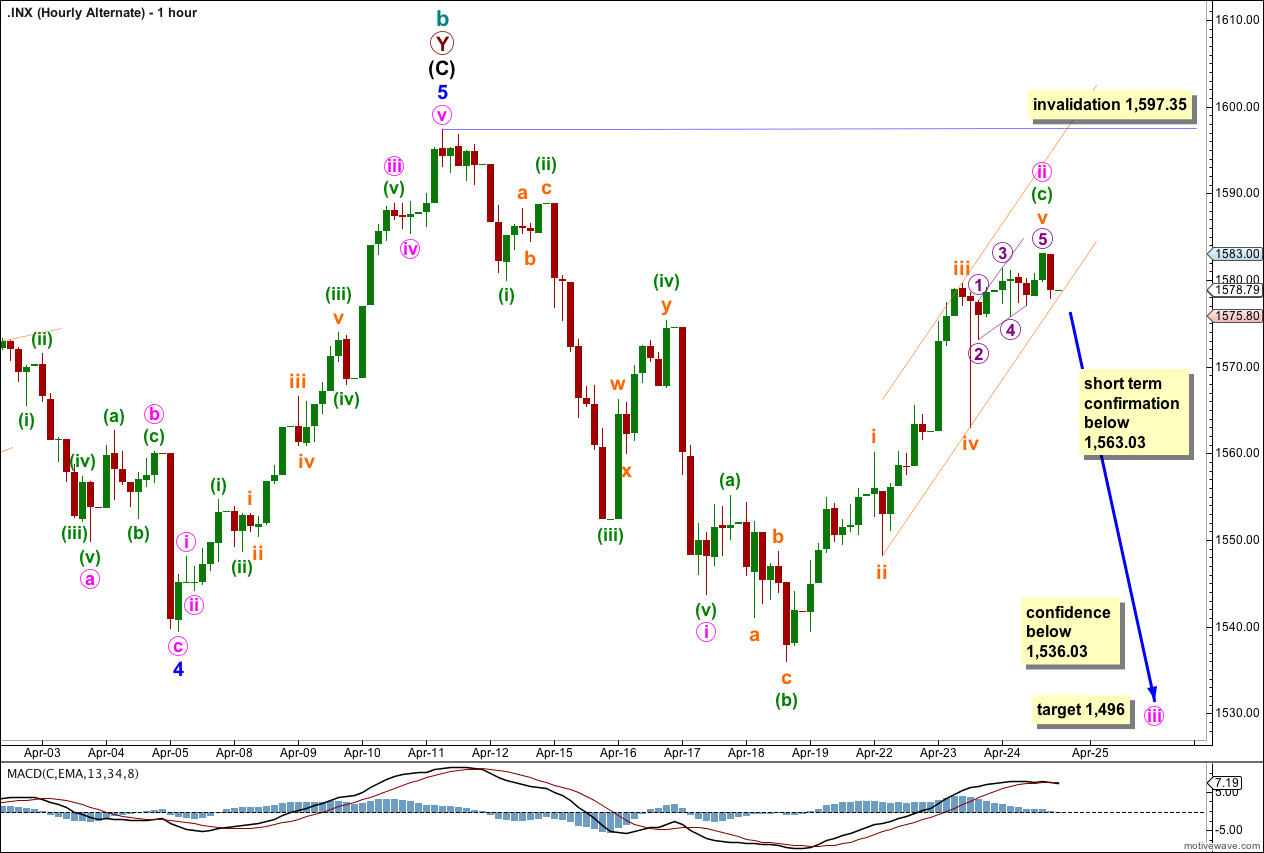
So far minute wave ii is a very deep 76% correction of minute wave i. The structure may again be seen as complete and should be over here because there is almost no room left for upwards movement. Second waves often are very deep corrections.
If minute wave ii is finally over then at 1,496 minute wave iii would reach 1.618 the length of minute wave i. Movement below 1,563.03 would invalidate the main hourly wave count at minute degree and indicate that this target may be likely.
Please note: movement below 1,563.03 does not confirm a trend change at cycle degree for the daily chart. It just indicates that for now the upwards trend is over and a new downwards trend has begun. The main wave count would then have an invalidation point which moves down to 1,536.03.
Further movement below 1,536.03 would indicate the downwards trend is a higher degree. At that stage we may have some confidence in the target of 1,496 but again this is not evidence of a trend change at cycle degree.
Wow, that is quite abit higher than where we are now. Of course, if the bullish scenario were unfolding, I assume we would see an increase in upwards momentum, which would probably call into question the bear case.
In any event, the bear count is alive and well, and today’s late day swoon may be the beginning of the end.
Lara,
I am just curious if there is a point at which you would favor the bullish historical analysis scenario that has us in a new bull market. I feel we are nearing the end of this move, but I have learned that you have to just let the market action dictate your approach, and we continue to move higher. At what price level does the bear case become less plausible or invalidated?
Thanks,
Peter
A most excellent question.
Happily I can give you a very specific answer.
At 1,858.03 cycle wave b would reach 138% the length of cycle wave a. This is the maximum common length of a b wave in relation to an a wave within a flat correction.
Beyond this price point the probability of the main monthly wave count reduces and the bullish alternate increases. At that point I would swap them over.
Although the Dow has passed this point it is my judgement (from years of analysing these two markets daily) that the S&P has much more normal looking EW structures and better Fibonacci ratios. So I would not let what the Dow is doing or not doing influence my S&P count too much.