
Last analysis expected upwards movement from the main wave count for Monday’s session which is what we have seen.
Price remains below the invalidation point on the alternate daily and hourly wave counts and so both wave counts remain valid.
Click on the charts below to enlarge.
Main Wave Count.
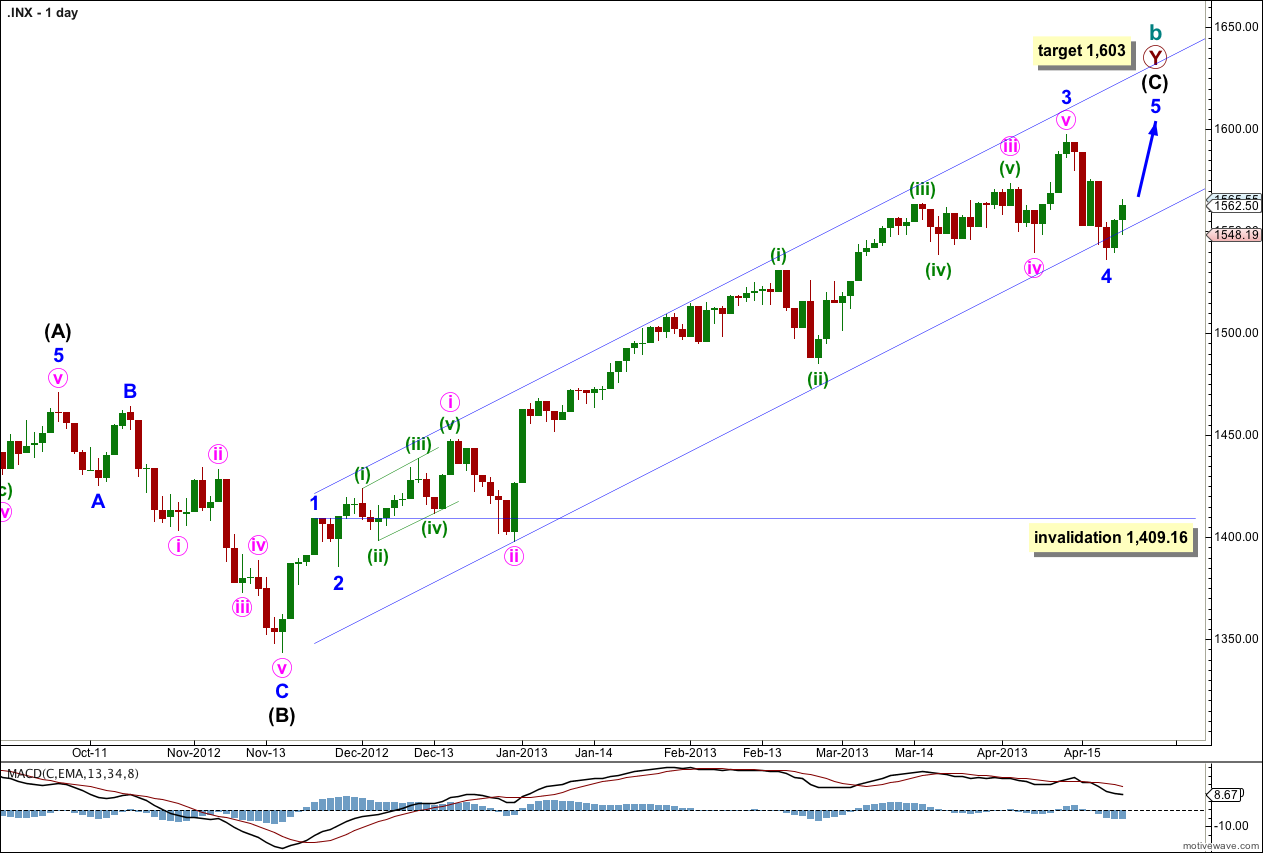
This is my main wave count because we should always assume the trend remains the same, until proven otherwise. We do not have sufficient confirmation of a trend change so we should assume we shall see more upwards movement.
Although the alternate wave count has a channel breach this main wave count does not. The channel is only overshot. I want to see a clear channel breach of this channel also before I have confidence in a trend change.
The channel drawn here is a conservative best fit. Draw the first trend line from the highs of minor waves 1 to 3 and push it upwards to enclose all upwards movement. Place a parallel copy upon the low of minute wave ii within minor wave 3. Minor wave 4 should find some support about the lower edge of this channel.
Minor wave 4 may now be complete; it subdivides into a three on the hourly chart. Alternatively, we may move the degree of labeling within it down one degree and only minute wave a within minor wave 4 may have completed. I expect it is most likely to be complete because it is in proportion to other corrections within intermediate wave (C) and it has lasted a Fibonacci 5 days.
There is no Fibonacci ratio between minor waves 1 and 3. This means it is more likely we shall see a Fibonacci ratio between minor wave 5 and either of 1 or 3. At 1,603 minor wave 5 would reach equality with minor wave 1. This is the most likely Fibonacci relationship for minor wave 5 so this target has a good probability.
If it continues further minor wave 4 may not move into minor wave 1 price territory. This wave count is invalidated with movement below 1,409.16.
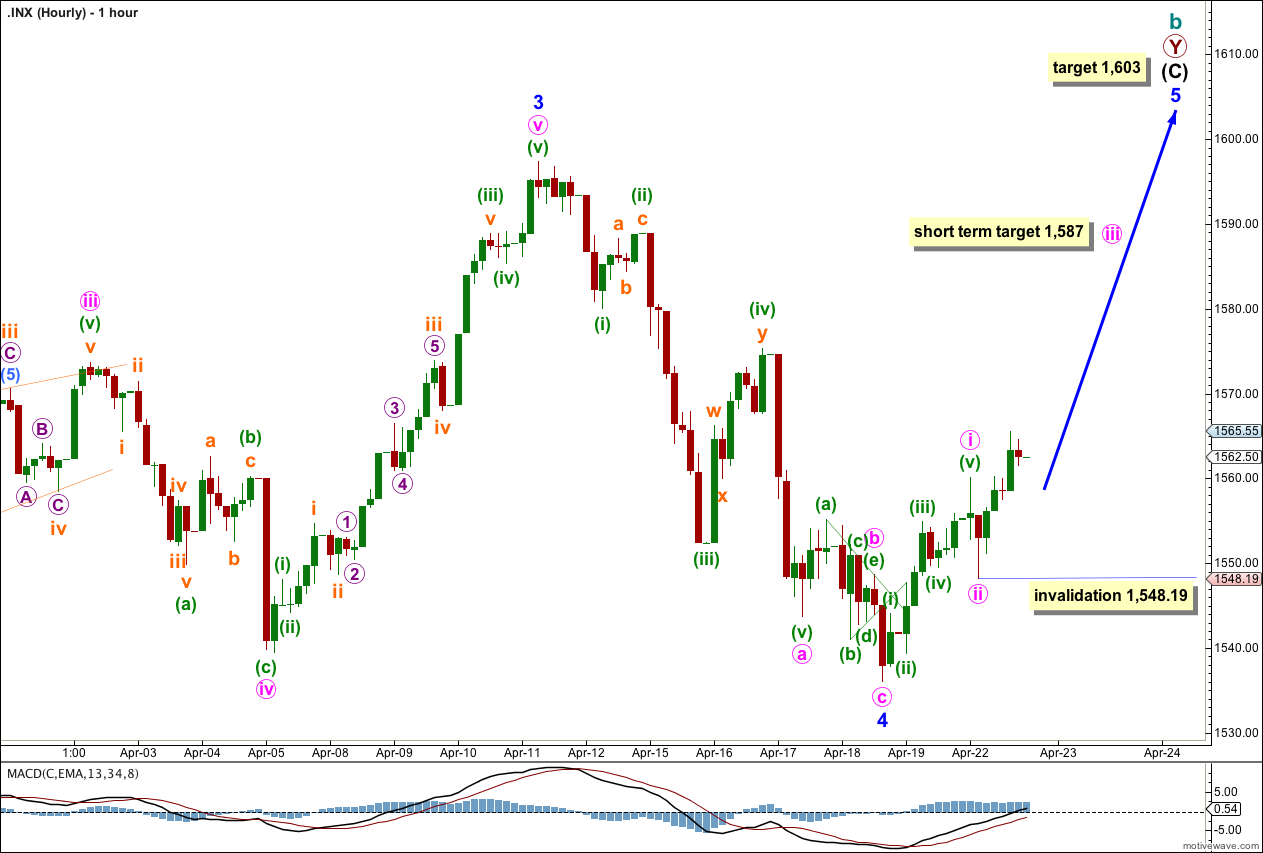
Price moved higher as this main wave count expected, and importantly MACD indicates that momentum has increased.
I have moved the degree of labeling within minor wave 5 up one degree. With the increase in momentum it may be that minute wave iii has begun.
Ratios within minute wave i are: minuette wave (iii) has no Fibonacci ratio to minuette wave (i), and minuette wave (v) is 1.06 longer than 0.618 the length of minuette wave (iii).
Minute wave ii was a shallow zigzag. We may expect minute wave iv to be a deep flat, combination or double zigzag.
At 1,587 minute wave iii would reach 1.618 the length of minute wave i. This target fits nicely with the target at 1,603 which is another reason why I have moved the degree of labeling within minor wave 5 up one degree today.
Within minute wave iii minuette wave (ii) may not move beyond the start of minuette wave (i). This wave count is invalidated at minute degree with movement below 1,548.19.
If this hourly wave count is invalidated with downwards movement then I would move the labeling within minor wave 5 back down one degree. Downwards movement would be labeled minute wave ii and the invalidation point would return to 1,536.03.
Alternate Wave Count.
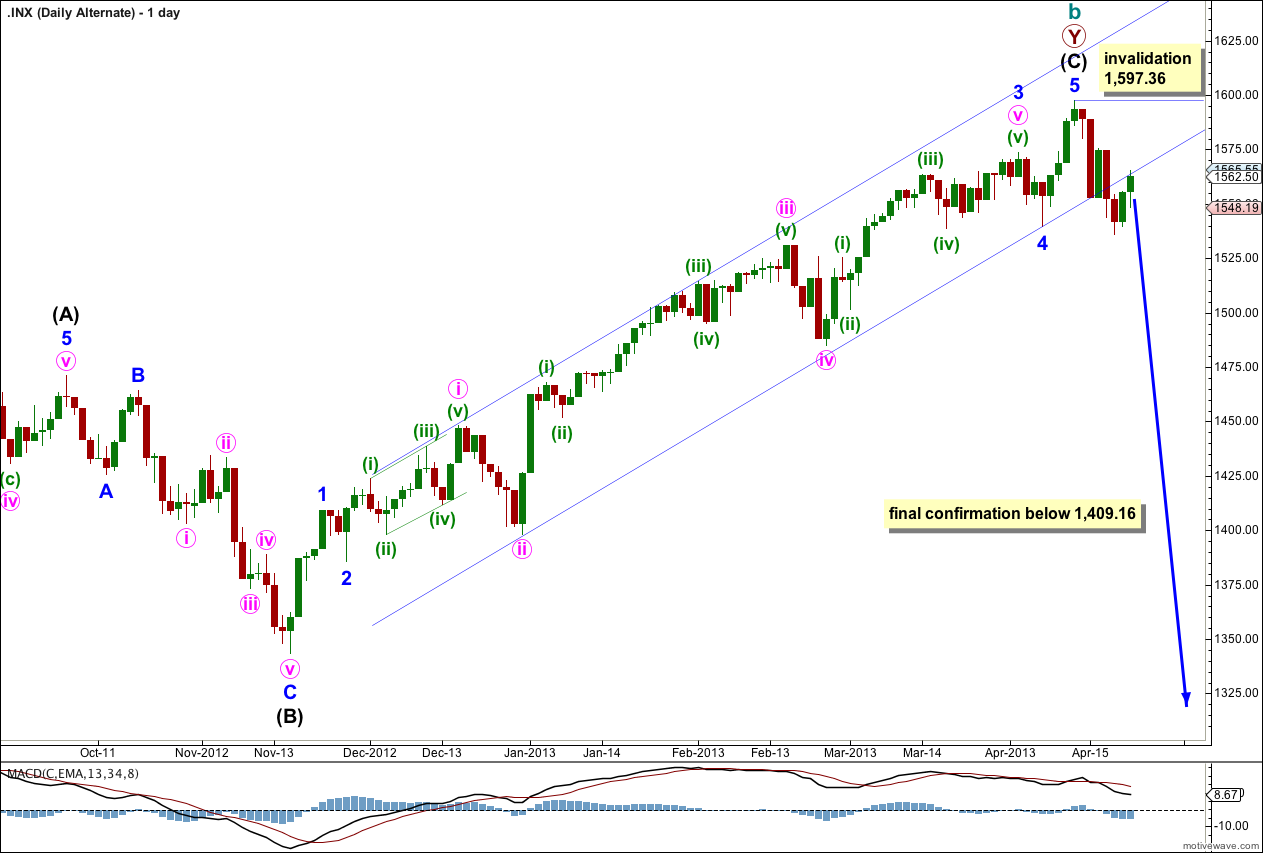
It is again possible that we have seen a trend change, but at this early stage we do not have enough confirmation. There is a hanging man candlestick pattern, but this is an indicator only and not a reversal pattern.
This wave count agrees with MACD as an indicator of momentum. The strongest piece of movement is minuette wave (iii) within minute wave iii within minor wave 3, the very middle of the third wave.
The channel drawn here is a conservative best fit. Draw the first trend line from the low of minute wave ii within minor wave 3 to the low of minor wave 4, then place a parallel copy on the high of minute wave i within minor wave 3. This channel has been breached, but it is possible to redraw the channel (as on the main daily chart) to see candlesticks for the last three days as just an overshoot and not a breach. I want to see both channels clearly breached to have any confidence in this wave count.
Final confirmation would come with invalidation of the main wave count with price movement below 1,409.16. At that stage we may have confidence that the S&P 500 should be in a new downwards trend to last one to several years and take price substantially below 666.76.
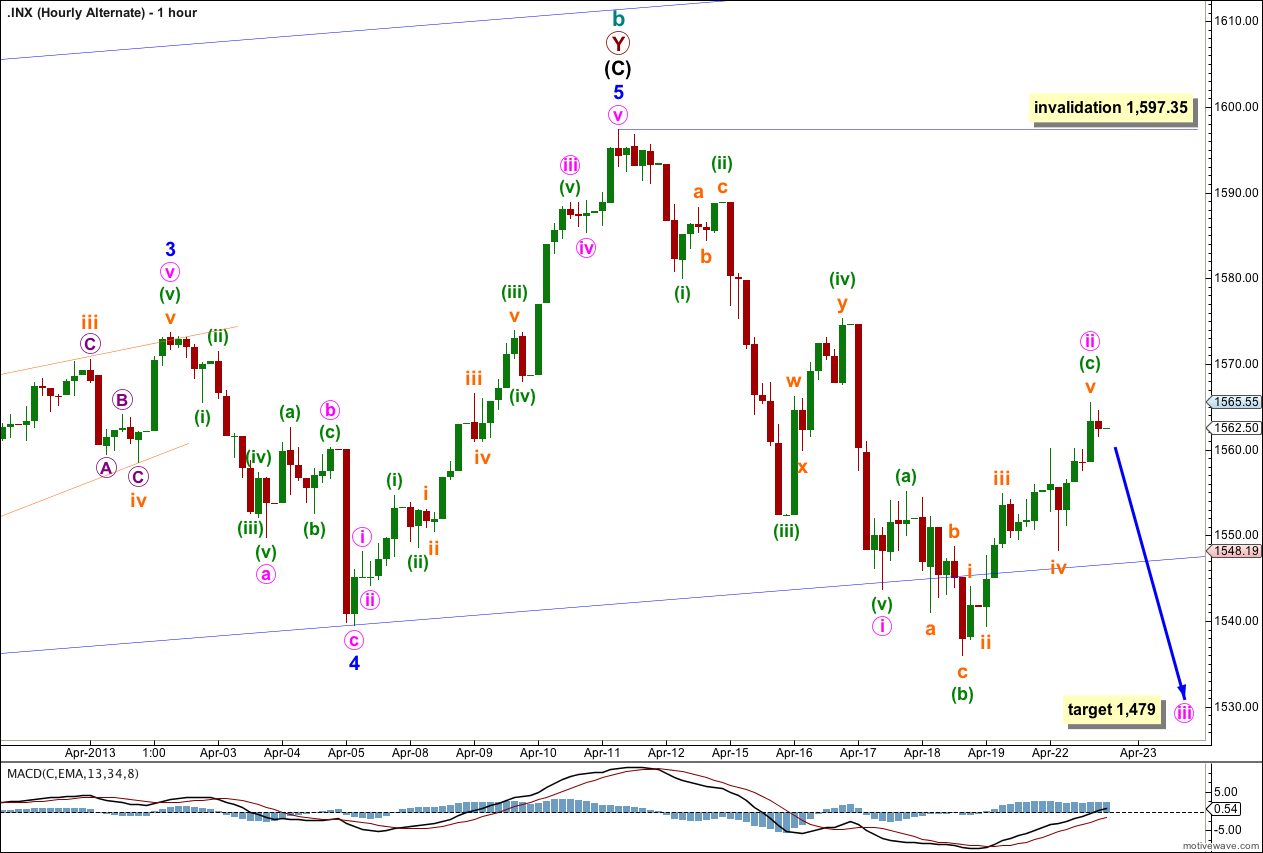
On the five minute chart this upwards movement as labeled here fits just as well for this alternate as it does for the main wave count. Within minute wave ii minuette wave (c) may have extended higher. Minuette wave (c) is now just 0.48 short of 2.618 the length of minuette wave (a).
Within minuette wave (c) there are no adequate Fibonacci ratios between subminuette waves i, iii and v. This reduces the probability of this wave count slightly.
If minute wave ii is over then at 1,479 minute wave iii would reach 1.618 the length of minute wave i.
If minute wave ii moves any higher it may not move beyond the start of minute wave i. This wave count is firmly invalidated with movement above 1,597.35.
OK, yes get you, thanks.
Lara, in the main hourly count, why is the invalidation point 1548.9? That seems to be end of wave circle pink ?
Yes, that’s because I’m fairly confident that waves i and ii pink are over.
This means that within wave iii pink no second wave correction can move beyond the start of it’s first wave.
Does this make sense?
Hi Lara, a bit of a problem accessing the video today. First Friday’s came up, now only get an error. Guess this possibly means you’re fixing it. Cheers Gary
Hi Gary,
Yes, I’m having problems uploading today’s video to our video host service.
Trying again….
Should have it fixed soon! Sorry about the inconvenience
Hi Gary,
It’s fixed now.