
The main wave count from last analysis expected upwards movement for Friday’s session which is what we have seen.
The wave counts remain the same on the daily charts. The alternate hourly chart is slightly adjusted. Invalidation / confirmation points remain the same.
Click on the charts below to enlarge.
Main Wave Count.
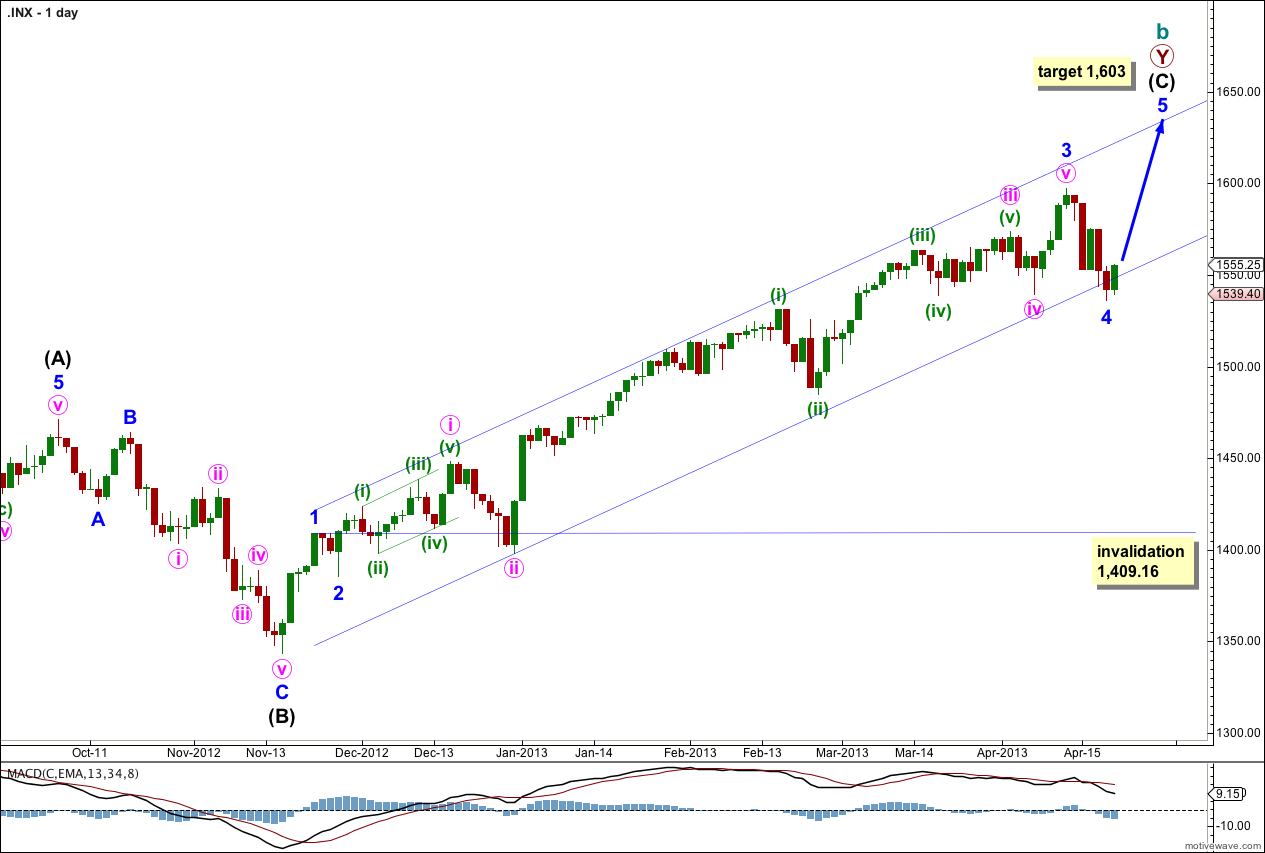
This is my main wave count because we should always assume the trend remains the same, until proven otherwise. We do not have sufficient confirmation of a trend change so we should assume we shall see more upwards movement.
Although the alternate wave count has a channel breach this main wave count does not. The channel is only overshot. I want to see a clear channel breach of this channel also before I have confidence in a trend change.
The channel drawn here is a conservative best fit. Draw the first trend line from the highs of minor waves 1 to 3 and push it upwards to enclose all upwards movement. Place a parallel copy upon the low of minute wave ii within minor wave 3. Minor wave 4 should find some support about the lower edge of this channel.
Minor wave 4 may now be complete, it subdivides into a three on the hourly chart. Alternatively we may move the degree of labeling within it down one degree and only minute wave a within minor wave 4 may have completed. I expect it is most likely to be complete because it is in proportion to other corrections within intermediate wave (C) and it has lasted a Fibonacci 5 days.
There is no Fibonacci ratio between minor waves 1 and 3. This means it is more likely we shall see a Fibonacci ratio between minor wave 5 and either of 1 or 3. At 1,603 minor wave 5 would reach equality with minor wave 1. This is the most likely Fibonacci relationship for minor wave 5 so this target has a good probability.
If it continues further minor wave 4 may not move into minor wave 1 price territory. This wave count is invalidated with movement below 1,409.16.
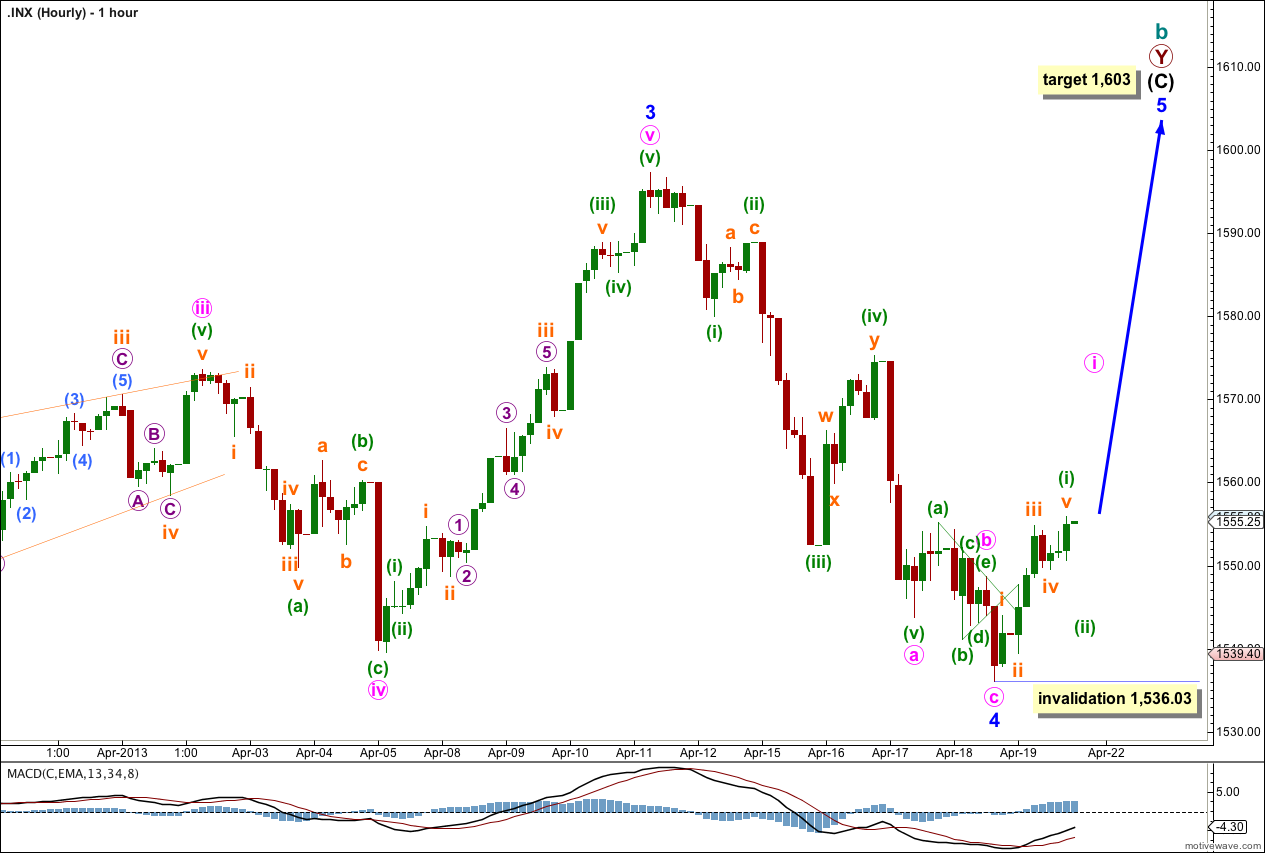
On the hourly chart this wave count has the best fit. Within downwards movement for minor wave 4 minute wave b subdivides into a running contracting triangle nicely on the five minute chart. It is most likely that minor wave 4 was over as a zigzag correction lasting a Fibonacci 5 days.
Minor wave 5 may have begun on Friday. Within it minuette wave (i) may be complete. On Monday minuette wave (ii) may not move beyond the start of minuette wave (i). this wave count is invalidated at minuette degree with movement below 1,536.03.
There is not enough downwards movement at the end of minuette wave (i) to indicate that subminuette wave v is complete. It may move further upwards early in Monday’s session.
Alternate Wave Count.
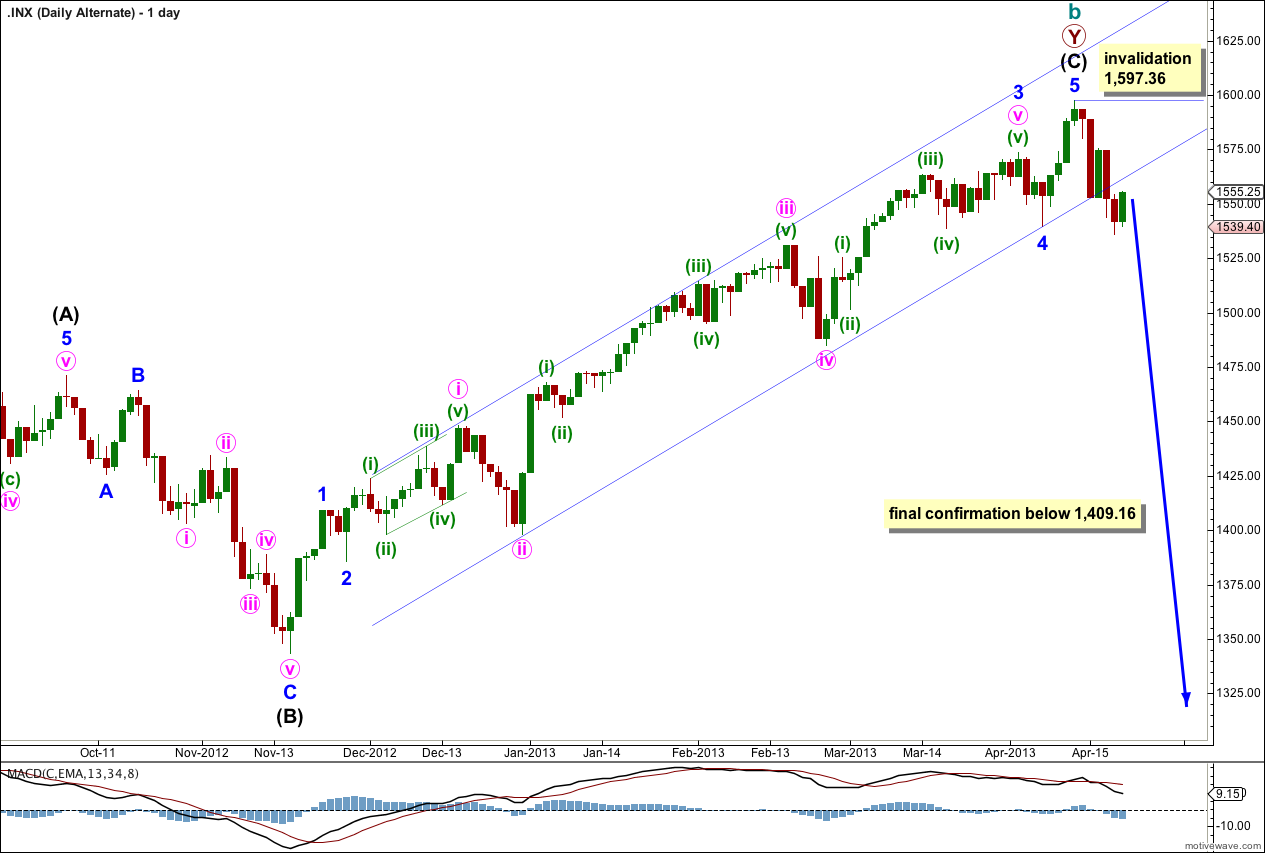
It is again possible that we have seen a trend change, but at this early stage we do not have enough confirmation. There is a hanging man candlestick pattern, but this is an indicator only and not a reversal pattern.
This wave count agrees with MACD as an indicator of momentum. The strongest piece of movement is minuette wave (iii) within minute wave iii within minor wave 3, the very middle of the third wave.
The channel drawn here is a conservative best fit. Draw the first trend line from the low of minute wave ii within minor wave 3 to the low of minor wave 4, then place a parallel copy on the high of minute wave i within minor wave 3. This channel has been breached, but it is possible to redraw the channel (as on the main daily chart) to see yesterday’s candlestick as just an overshoot and not a breach. I want to see both channels clearly breached to have any confidence in this wave count.
Final confirmation would come with invalidation of the main wave count with price movement below 1,409.16. At that stage we may have confidence that the S&P 500 should be in a new downwards trend to last one to several years and take price substantially below 666.76.
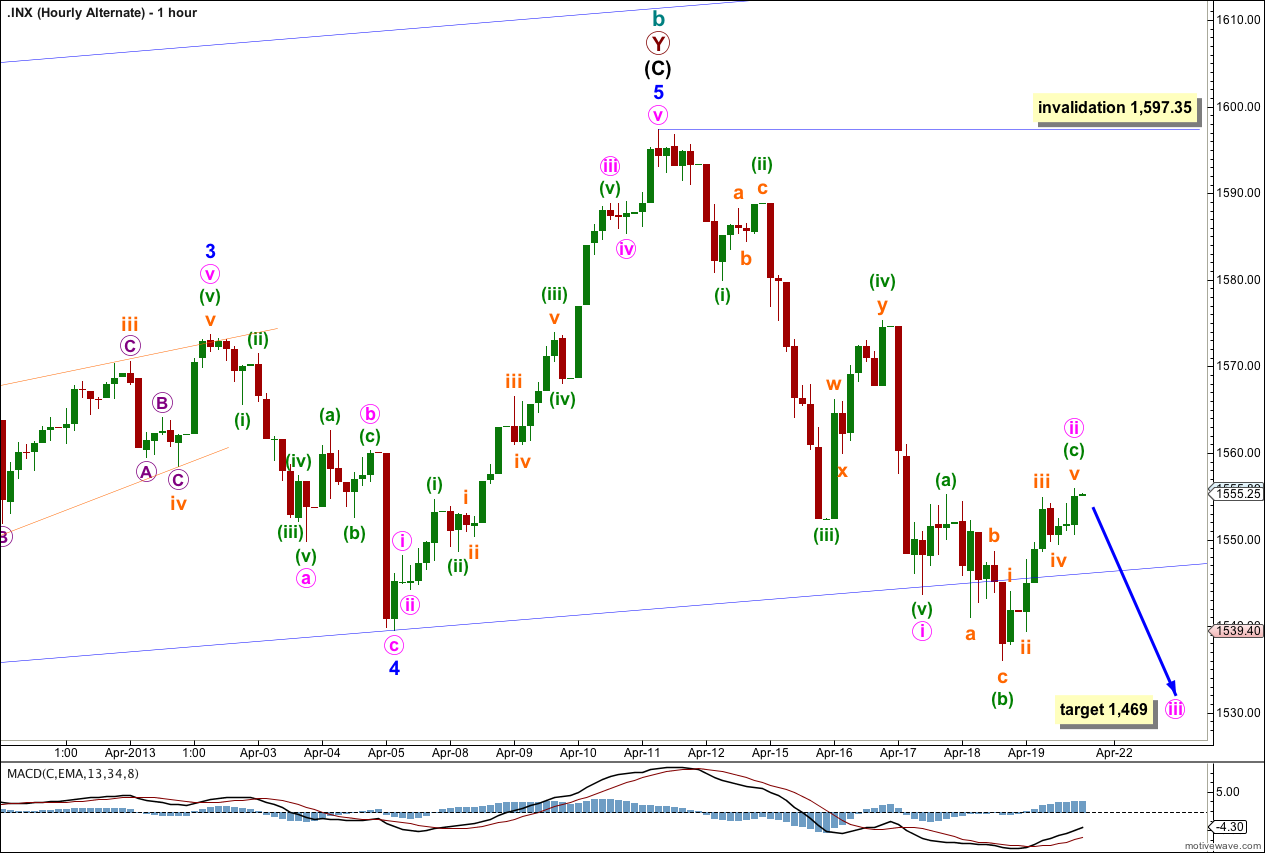
On the hourly chart this alternate does not have as good a fit as the main wave count.
Within the new downwards trend we may have minute wave i complete and minute wave ii may be either complete or very close to it.
Minute wave ii may be an expanded flat correction. Within it minuette wave (b) is a 167% correction of minuette wave (a), and minuette wave c is 1.32 longer than 1.618 the length of minuette wave (a). Within minute wave ii subminuette wave v may yet move higher when markets open on Monday.
The problem with this wave count at the hourly chart level is within minuette wave (b) of minute wave ii. Subminuette wave b zigzag has a very truncated C wave within it. On the five minute chart it looks forced. It looks like there is a triangle in that position and this alternate wave count tries to ignore that. I will consider it though because the subdivisions do fit.
Minute wave ii may not move beyond the start of minute wave i. This alternate wave count is firmly invalidated with movement above 1,597.35.
Cool… thanks
What do you think of this guys count ??? http://www.thewavetrading.com/wp-content/uploads/2013/04/SPX-D-FROM-NOV-165.png
It’s not a valid count.
What is (1) ed?? is that a wave 1 ending diagonal? This does not make sense.
Is this trying to label this upwards movement as a first wave? First waves don’t subdivide into double zigzags.
Within this structure the first wave A does not subdivide into a five (which is must). The subdivisions for this count are not labeled here so I cannot tell how this problem is resolved, it isn’t.
In short this is not a valid wave count. It is nonsense.