
Yesterday’s analysis expected a little more upwards movement overall. The target at 1,590 – 1,591 has now been passed and the structure is incomplete. A new target is calculated.
Click on the charts below to enlarge.
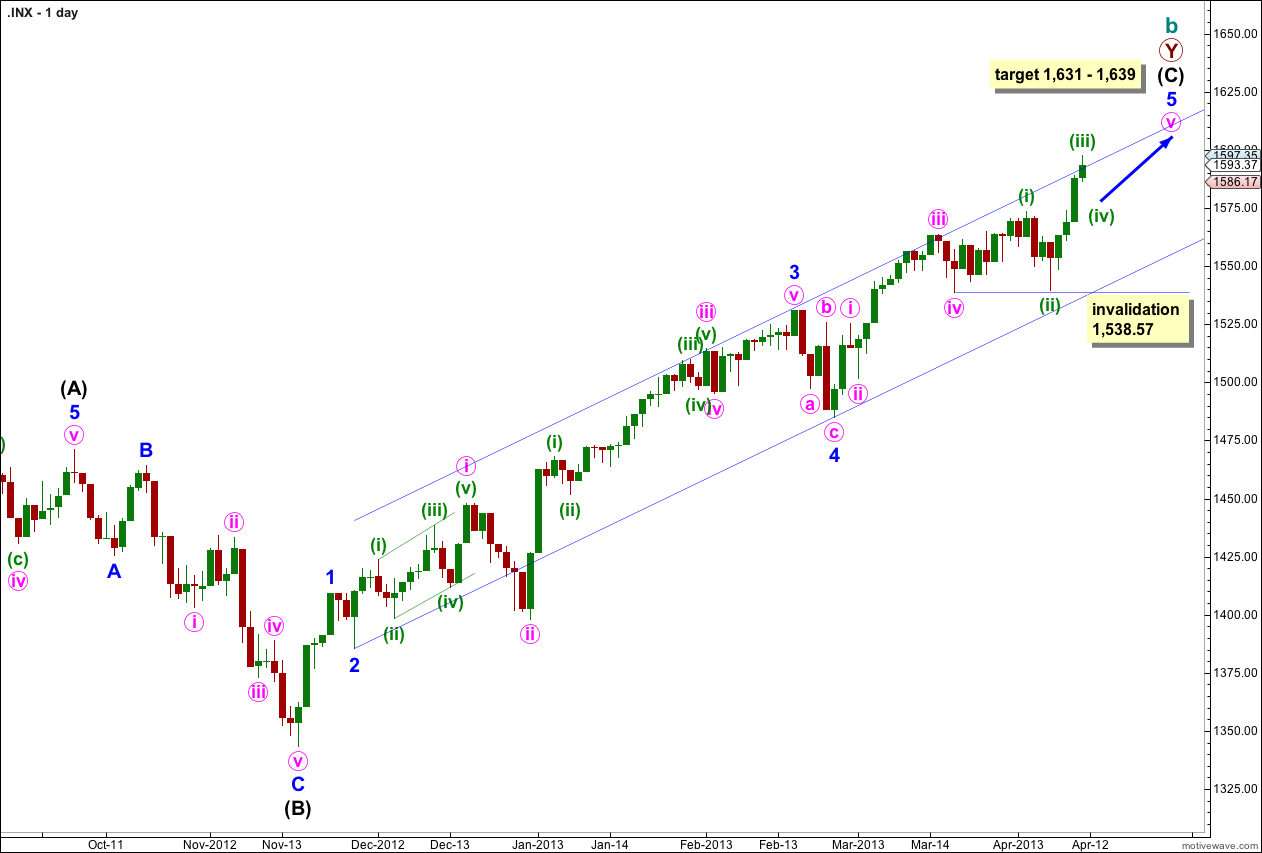
This structure is nearing completion, but it is not there yet. Cycle wave b is a double zigzag and the end of the second zigzag is nearly over. Intermediate wave (C) is unfolding as a simple impulse and remains mostly contained within its trend channel. Price may find resistance about here at the upper end of this channel. Draw it first with a trend line from the lows of minor waves 2 to 4, then place a parallel copy upon the high of minor wave 3.
Cycle wave b is now over 105% the length of cycle wave a and so this structure at super cycle degree is an expanded flat correction, the most common type of flat.
At 1,631 minor wave 5 would reach equality in length with minor wave 3. At 1,639 minute wave v would reach 1.618 the length of minute wave iii.
When price reaches this target zone we will use an alternate wave count to see if the structure could be complete and a trend change could occur.
Movement below the channel containing intermediate wave (C) would be initial confirmation of a trend change. While price remains within this channel we shall expect more upwards movement.
Within minute wave v no second wave correction may move beyond the start of its first wave. This wave count is invalidated with movement below 1,538.57.
In another three sessions minor wave 5 would have lasted a Fibonacci 34 days. It could possibly end here, although Fibonacci time relationships are not as reliable as price. The most reliable way to find where this trend may end is the parallel channel and the target.
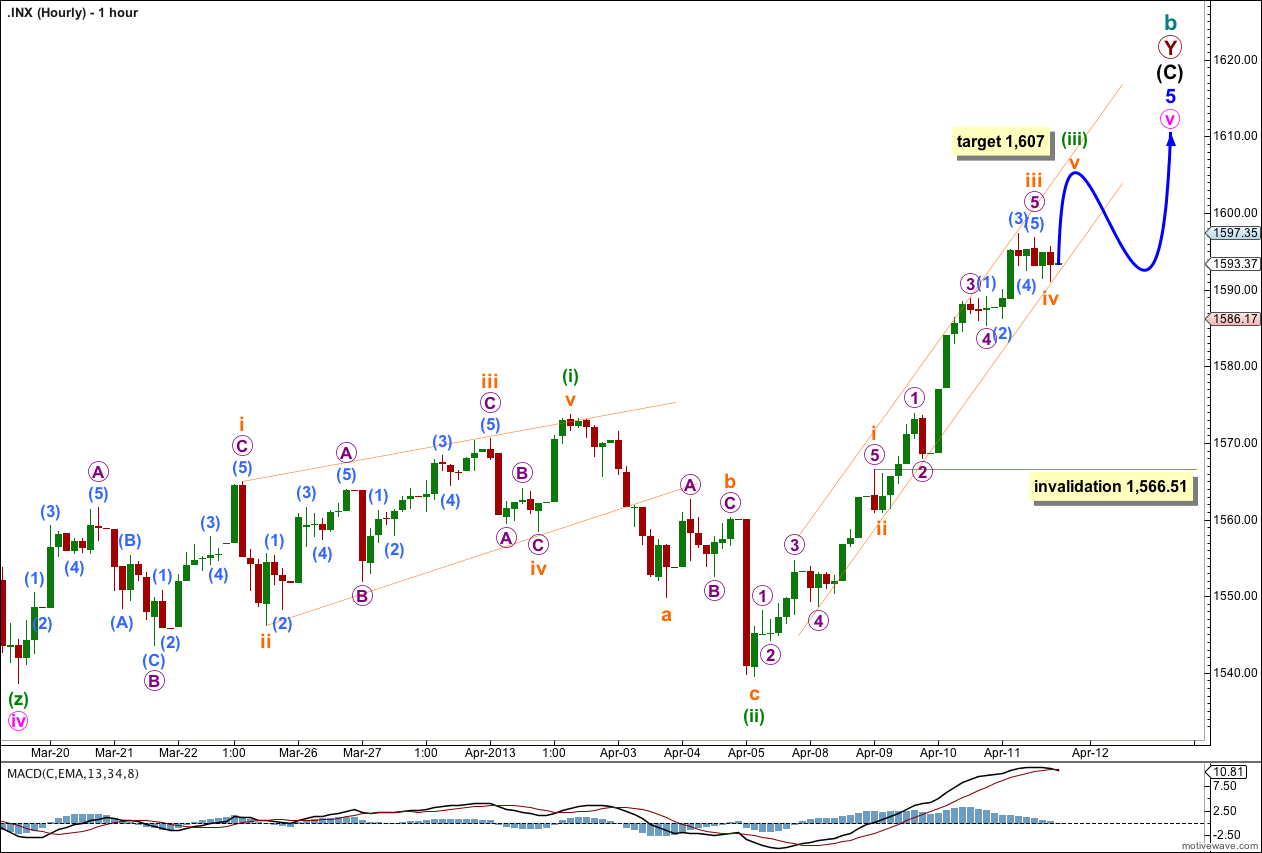
The structure for minuette wave (iii) so far looks incomplete. It needs a final fifth wave upwards to end it.
Subminuette wave iii moved higher to start Thursday’s session. It no has no Fibonacci ratio to subminuette wave i which makes it more likely we shall see a Fibonacci ratio between subminuette wave v and either of iii or i. At 1,607 subminuette wave v would reach 0.618 the length of subminuette wave i.
Ratios within subminuette wave iii are: micro wave 3 is just 0.53 points short of 1.618 the length of micro wave 1, and micro wave 5 has no Fibonacci ratio to either of micro waves 1 or 3.
On the five minute chart subminuette wave iv looks complete. It is highly likely it is over here and the final fifth wave upwards should move price higher tomorrow. If subminuette wave iv were to continue further as a triangle or double combination then it may not move into subminuette wave i price territory. The invalidation point remains the same at 1,566.51.
When subminuette wave v completes minuette wave (iii) then we should expect a longer lasting shallow sideways correction for subminuette wave (iv) to last about two to five days.
Draw a best fit parallel channel about minuette wave (iii). Draw the first trend line from the lows of subminuette waves ii to iv, then place a parallel copy upon the high of micro wave 3 within subminuette wave iii. Expect the fifth wave to end either midway within the channel, or about the upper edge. When the channel is breached clearly by downwards movement then minuette wave (iii) should be over and minuette wave (iv) should be underway.
Dear Lara,
You wrote, “When price reaches this target zone we will use an alternate wave count to see if the structure could be complete and a trend change could occur.” You have also said something similar in the audio portion of you analysis. But if I remember correctly, you hinted towards trying to find an alternate that would allow for further upside movement by moving the degree of labeling down one degree.
Please elaborate on the alternate for trend change. I am not sure I understand that. Also, if an alternate for further upside movement is viewed, how much upside movement might we be talking about?
Thanks again for your outstanding analysis and service.
Have a great weekend.
Rodney Mruk
That’s a good point Rodney, and you’re right, what I’ve said contradicts itself.
That’s because if we see too much more upwards movement then the bullish wave count is going to actually look even more likely.
This wave count expected a new all time high was reasonably likely for the S&P because this is a cycle wave b of a flat correction, which often moves beyond the start of the a wave within a flat. But if it gets to longer than 138% the length of the a wave the probability will decrease. At that stage I would look at momentum and structure. The bullish wave count expects a third wave upwards, if it looks like that then that would fit.
So each time the target gets moved higher the situation is less clear. I cannot know at this stage if my alternate would expect upwards movement or a trend change because I don’t know what momentum and structure would suggest until we get there.
However, we should always assume the trend remains the same until proven otherwise. So what I’ll probably do is make the main wave count assume the trend remains up, and the alternate will look at a trend change. Until the channel is breached, then we have confirmation of a trend change.
I hope this makes sense!