
Movement slightly above 1,573.66 to a new high at 1,573.89 has invalidated the alternate wave count and confirmed the main wave count. We now have clarity and can have more confidence in the target on the main wave count.
I have just the one daily and one hourly wave count for you today.
Click on the charts below to enlarge.
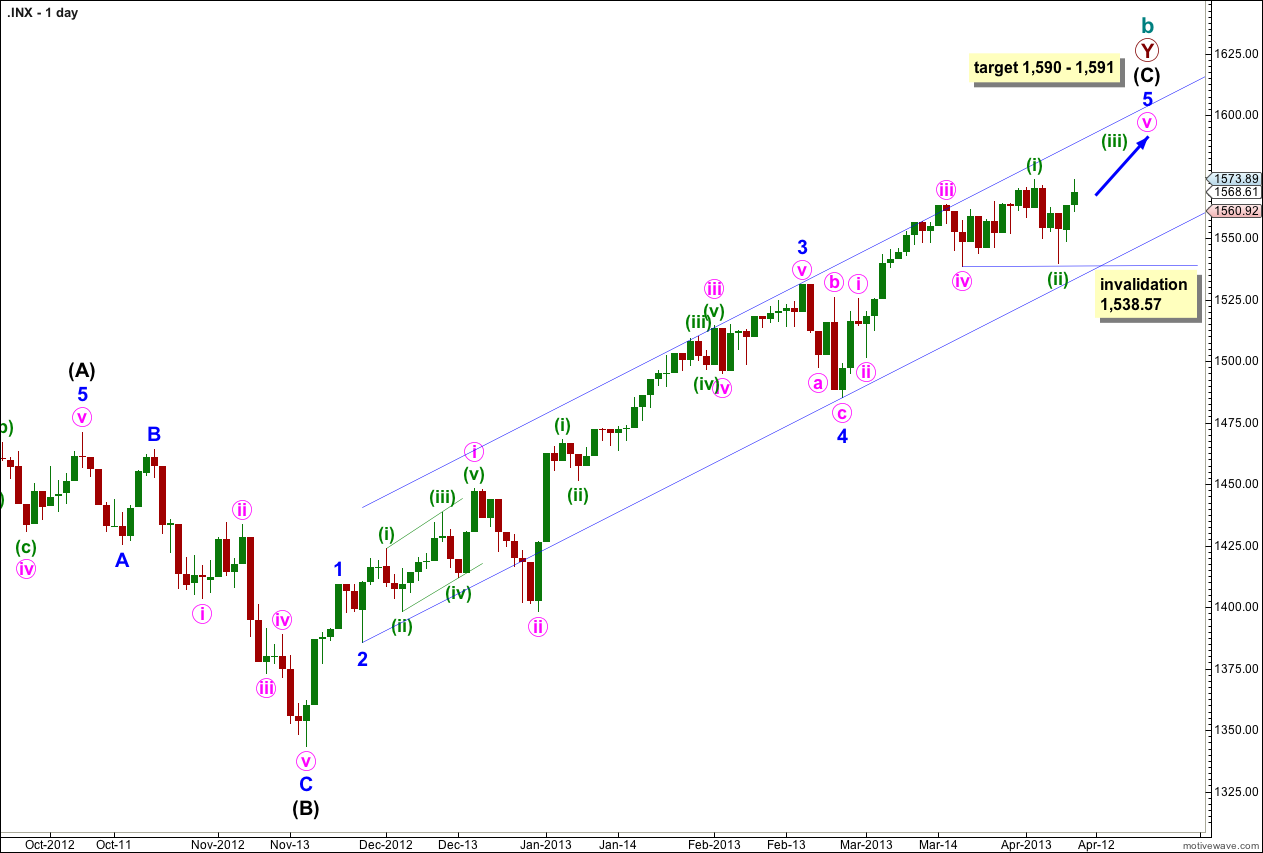
Very clearly we have not yet had a trend change. Price will not turn at our first target and so we will now use the second.
This structure is nearing completion. Cycle wave b is a double zigzag and the end of the second zigzag is nearly over. Intermediate wave (C) is unfolding as a simple impulse and remains recently contained within its trend channel. Price may find resistance at the upper end of this channel. Draw it first with a trend line from the lows of minor waves 2 to 4, then place a parallel copy upon the high of minor wave 3.
Cycle wave b is now 105% the length of cycle wave a and so this structure at super cycle degree is an expanded flat correction, the most common type of flat.
At 1,590 intermediate wave (C) would reach 0.618 the length of intermediate wave (A). At 1,591 minor wave 5 would reach 1.618 the length of minor wave 1.
When price reaches this target zone we will use an alternate wave count to see if the structure could be complete and a trend change could occur.
Movement below the channel containing intermediate wave (C) would be initial confirmation of a trend change. While price remains within this channel we shall expect more upwards movement.
Within minute wave v no second wave correction may move beyond the start of its first wave. This wave count is invalidated with movement below 1,538.57.
In another five sessions minor wave 5 would have lasted a Fibonacci 34 days. It could possibly end here, although Fibonacci time relationships are not as reliable as price. The most reliable way to find where this trend may end is the parallel channel and the target.
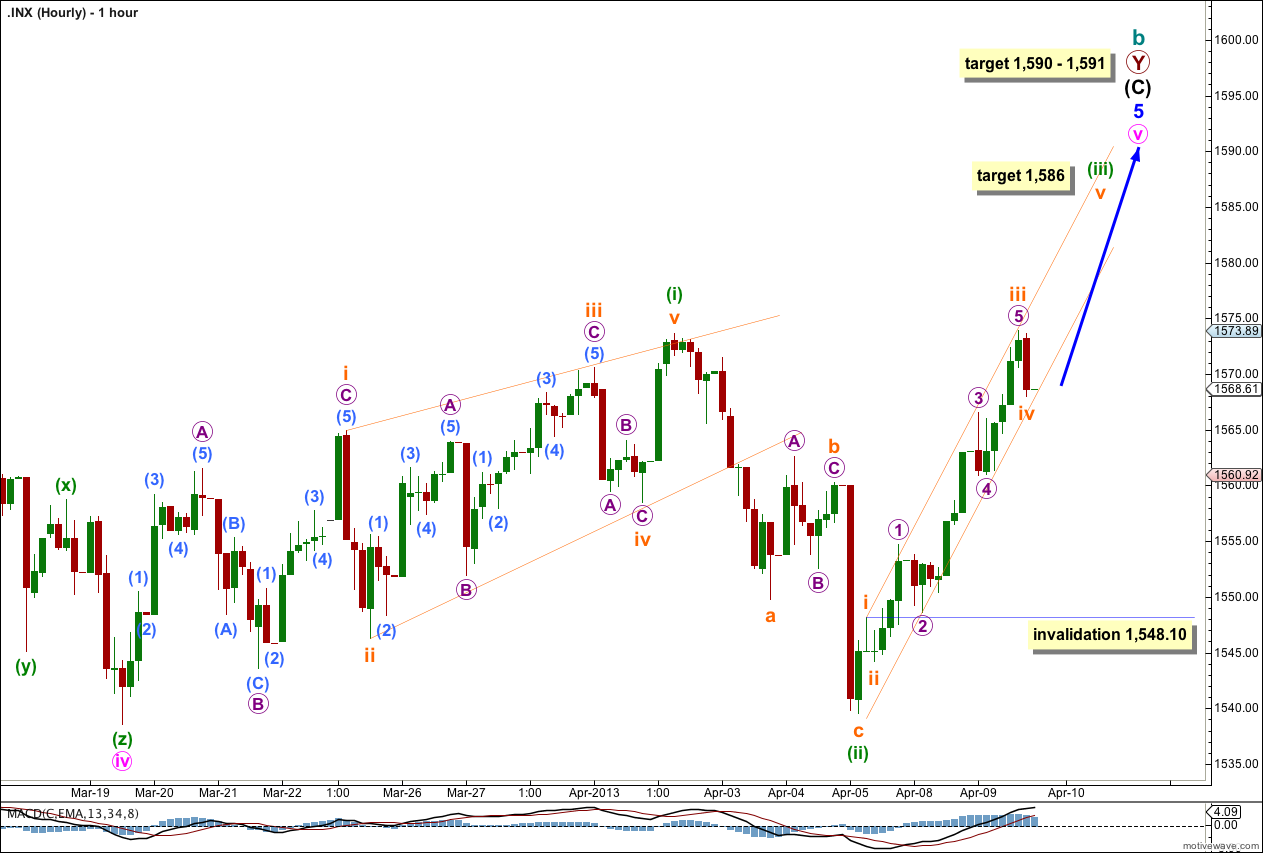
Within minute wave v minuette wave (i) was a leading contracting diagonal, and this was followed by a typical deep second wave correction for minuette wave (ii).
Minuette wave (iii) is underway. I have adjusted the wave count within this movement today.
We may now draw a channel about minuette wave (iii). Draw the first trend line from the highs of subminuette waves i to iii, then place a parallel copy upon the low of subminuette wave ii and push it down further to sit on the low of micro wave 2. Expect subminuette wave v to end about the upper edge of the channel. When this channel is breached by subsequent downwards movement then minuette wave (iii) should be over and minuette wave (iv) should be underway.
Within minuette wave (iii) subminuette wave iii has no Fibonacci ratio to subminuette wave i. Subminuette wave v would be more likely then to exhibit a Fibonacci ratio to either of subminuette waves i or iii. At 1,586 subminuette wave v would reach 0.618 the length of subminuette wave iii. If subminuette wave iv moves lower this target will have to also move correspondingly lower.
Ratios within subminuette wave iii are: micro wave 3 is 0.94 longer than 1.618 the length of micro wave 1, and micro wave 5 has no Fibonacci ratio to either of micro waves 1 or 3.
Within minuette wave (iii) subminuette wave iv may not move into subminuette wave i price territory. This wave count is invalidated with movement below 1,548.10.
When minuette wave (iii) is complete we may move the invalidation point up to the high of minuette wave (i) at 1,573.66. We may expect minuette wave (iv) to exhibit alternation with minuette wave (ii) and so it should be a shallow sideways moving correction, most likely a combination or possibly a triangle.
We sold everything with this pop 1588.85 looking to buy it all back in the 1525 area for the BIG run up.
Lara,
What is the likelihood that wave v green will be truncated?
Thanks for all your analysis and for continuing to remind us the trend remains the same until proven otherwise.
Blessings,
Rodney
Watch the behaviour of wave (iii) green. If it is strong and long, particularly if it is longer than 1.618 the length of (i) green, then the fifth wave may be truncated.
Truncations happen when the prior wave moved “too far too fast”.
I know I must sound like a stuck record, but it really is true that the trend is your friend 🙂