
Yesterday’s analysis expected further upwards movement with an increase in momentum, to a target at 1,586 which was expected to be reached within one or two sessions. Price moved higher as expected to reach up to 3.07 points above the target. Momentum has increased.
The wave count remains the same. The end target is almost met.
Click on the charts below to enlarge.
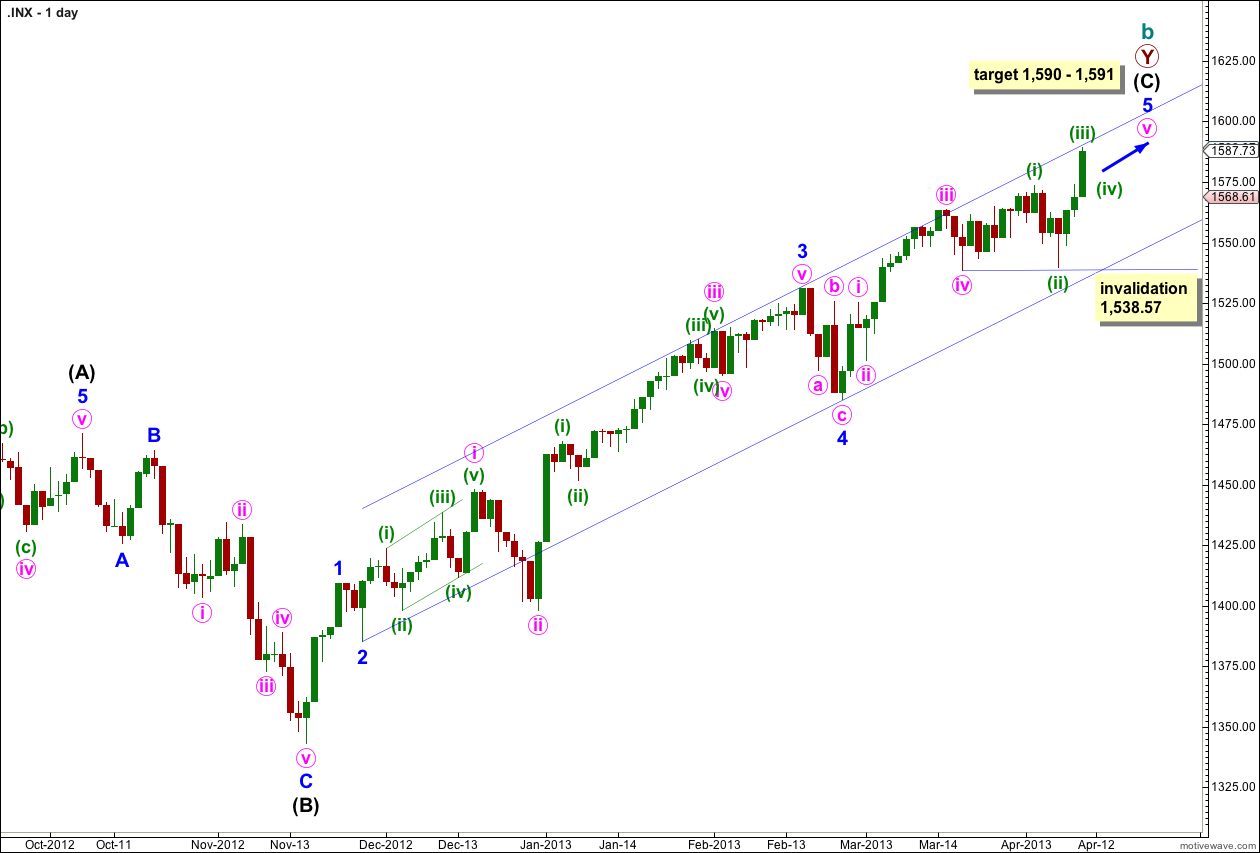
This structure is nearing completion. Cycle wave b is a double zigzag and the end of the second zigzag is nearly over. Intermediate wave (C) is unfolding as a simple impulse and remains recently contained within its trend channel. Price may find resistance here at the upper end of this channel. Draw it first with a trend line from the lows of minor waves 2 to 4, then place a parallel copy upon the high of minor wave 3.
Cycle wave b is now 105% the length of cycle wave a and so this structure at super cycle degree is an expanded flat correction, the most common type of flat.
At 1,590 intermediate wave (C) would reach 0.618 the length of intermediate wave (A). At 1,591 minor wave 5 would reach 1.618 the length of minor wave 1.
When price reaches this target zone we will use an alternate wave count to see if the structure could be complete and a trend change could occur.
Movement below the channel containing intermediate wave (C) would be initial confirmation of a trend change. While price remains within this channel we shall expect more upwards movement.
Within minute wave v no second wave correction may move beyond the start of its first wave. This wave count is invalidated with movement below 1,538.57.
In another four sessions minor wave 5 would have lasted a Fibonacci 34 days. It could possibly end here, although Fibonacci time relationships are not as reliable as price. The most reliable way to find where this trend may end is the parallel channel and the target.
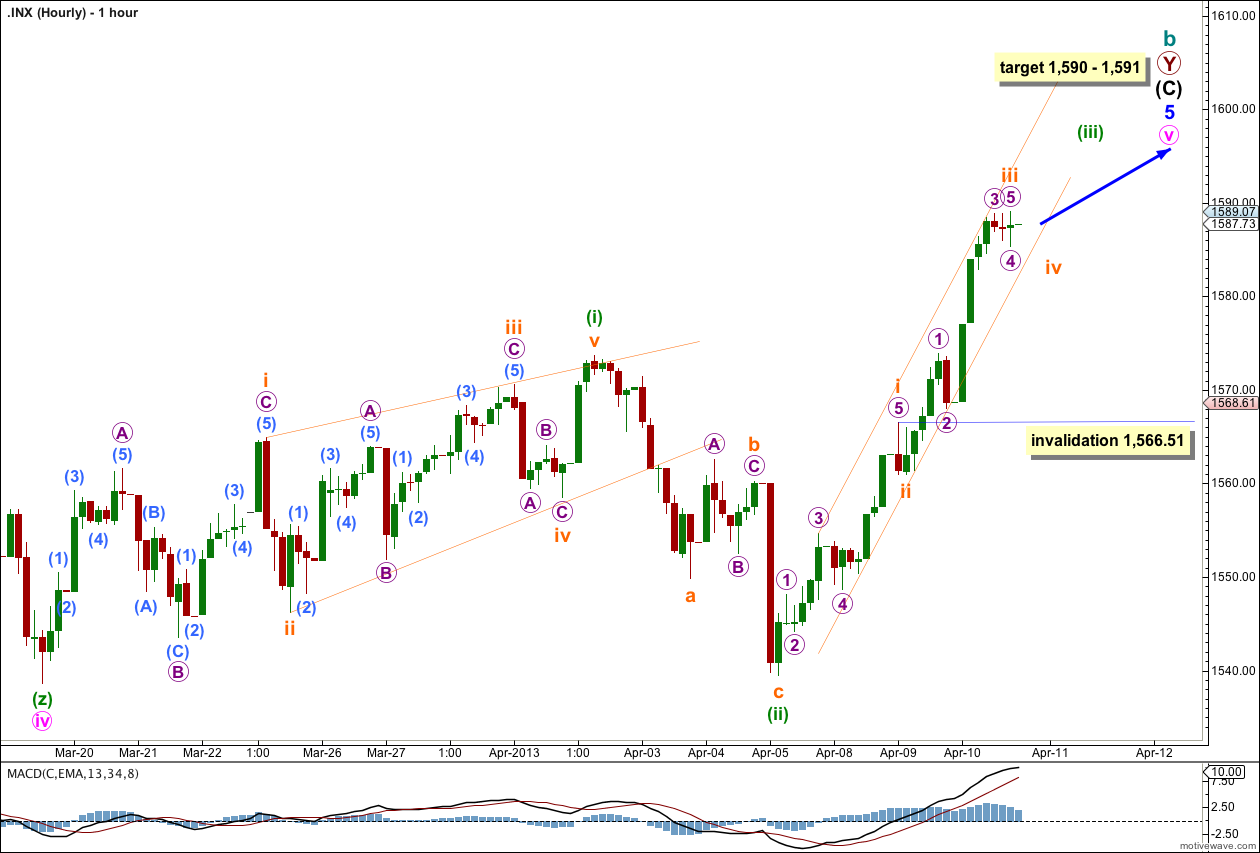
I have adjusted the wave count to be more in line with momentum as indicated my MACD.
It looks like the middle of this third wave unfolded during Wednesday’s session.
Subminuette wave iii may have ended at the end of Wednesday’s session. If it has ended it is 1.68 points longer than equality with subminuette wave i.
Ratios within subminuette wave i are: micro wave 3 has no Fibonacci ratio to micro wave 1, and micro wave 5 is 0.94 longer than 1.618 the length of micro wave 1.
Ratios within subminuette wave iii are: micro wave 3 is just 0.54 short of 1.618 the length of micro wave 1, and micro wave 5 may be over with no Fibonacci ratio to either of micro waves 1 or 3. Movement below 1,585.36 would indicate that micro wave 5 is complete and so subminuette wave iii would be complete. While price remains above 1,585.36 we must accept that micro wave 5 could move price a little higher.
I have drawn a best fit parallel channel about this upwards movement. Subminuette wave iv may find some support about the lower edge of this channel. Subminuette wave v to complete minuette wave (iii) may end either midway in the channel or should find resistance about the upper edge.
Subminuette wave iv may not move back into subminuette wave i price territory. This wave count is invalidated with movement below 1,566.51.
When subminuette wave iv is complete we may expect again more upwards movement for subminuette wave v to complete minuette wave (iii). When we know where subminuette wave iv has ended then we can calculate a target for minuette wave (iii) to end.
Overall this wave count expects a little more upwards movement with two sideways fourth wave corrections along the way, the second one longer lasting than the first, towards a final target which is very close by. This may take about three or four sessions.
Lara,
You do fantastic work and it’s always a joy to read through yourwave counts. I continue to learn all the time.
John Amon