
Last analysis expected Friday’s session to at least begin with some upwards movement, with the main wave count expecting only upwards movement. This is not what happened.
The wave counts remain the same on the daily charts. It may be significant that price remained just above the invalidation point on the main daily chart.
We need to see price break out of this range to invalidate one wave count and confirm the other before we shall have clarity.
Click on the charts below to enlarge.
Main Wave Count.
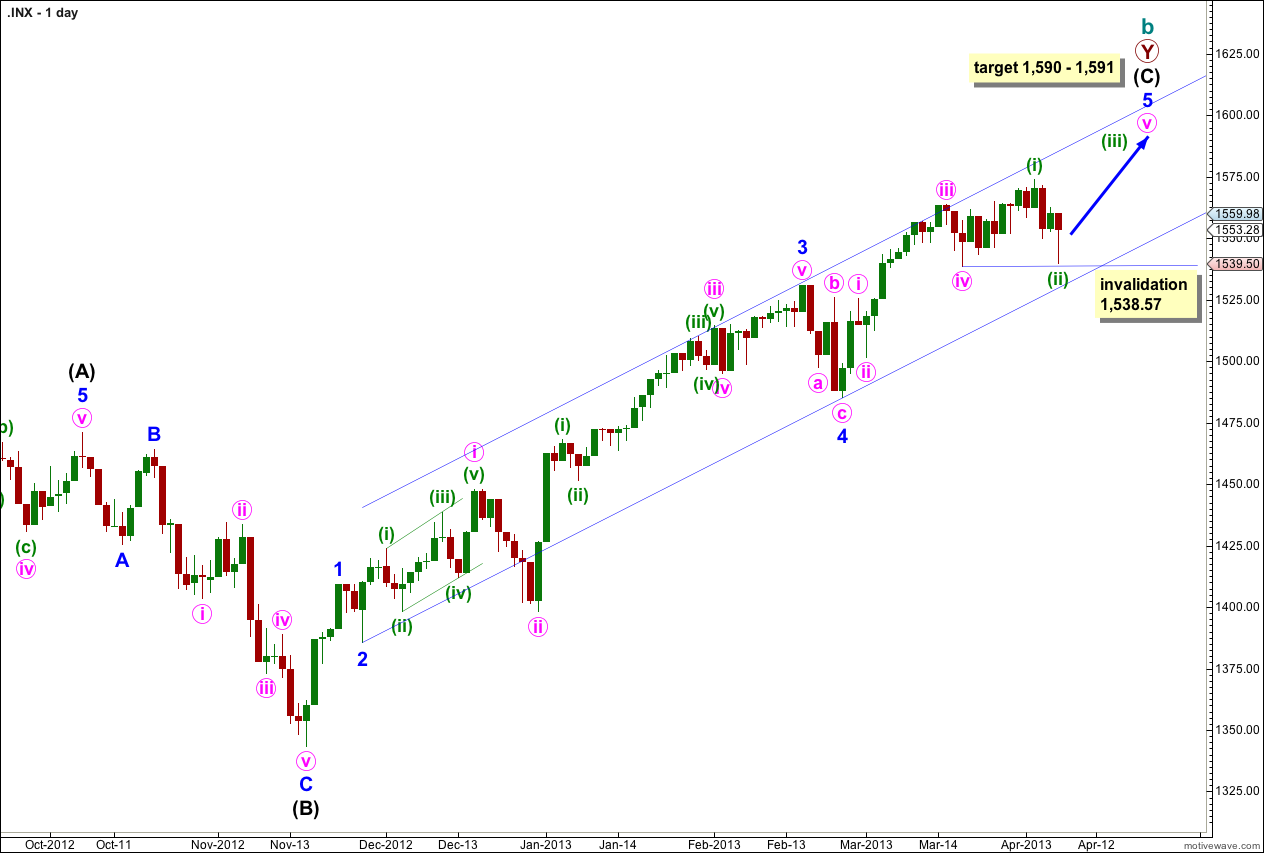
We should always assume the trend remains the same, until proven otherwise. “The trend is your friend”. With price remaining just above 1,538.57 this wave count remains valid. Price remains firmly with the parallel channel.
This structure is nearing completion. Cycle wave b is a double zigzag and the end of the second zigzag is nearly over. Intermediate wave (C) is unfolding as a simple impulse and remains recently contained within its trend channel. Price may find resistance at the upper end of this channel. Draw it first with a trend line from the lows of minor waves 2 to 4, then place a parallel copy upon the high of minor wave 3.
Cycle wave b is now 105% the length of cycle wave a and so this structure at super cycle degree is an expanded flat correction, the most common type of flat.
At 1,590 intermediate wave (C) would reach 0.618 the length of intermediate wave (A). At 1,591 minor wave 5 would reach 1.618 the length of minor wave 1.
When price reaches this target zone we will use an alternate wave count to see if the structure could be complete and a trend change could occur.
Movement below the channel containing intermediate wave (C) would be initial confirmation of a trend change. While price remains within this channel we shall expect more upwards movement.
Within minute wave v no second wave correction may move beyond the start of its first wave. This wave count is invalidated with movement below 1,538.57.
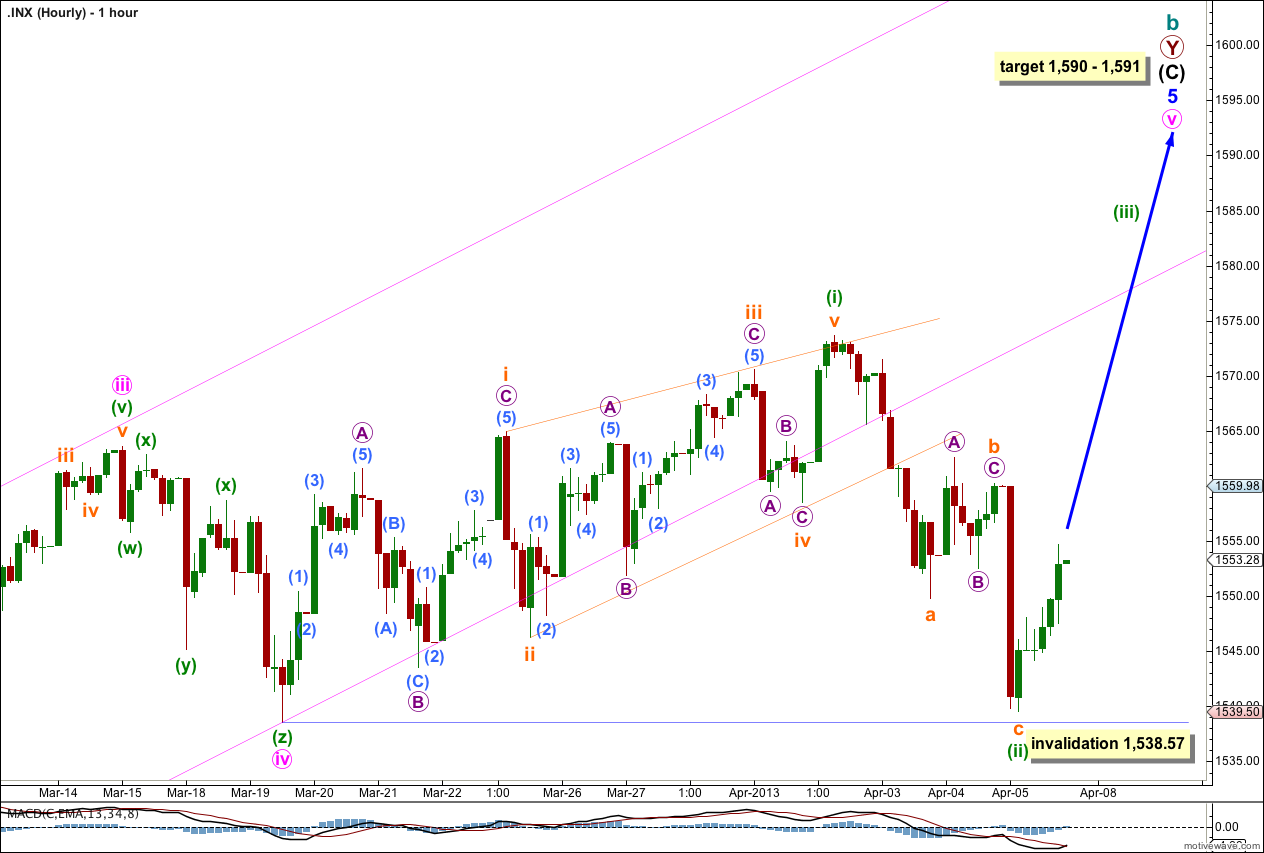
The depth of downwards movement during Friday’s session invalidated the previous labeling of this diagonal. The diagonal may have been leading for minuette wave (i). The subdivisions do fit very well.
Leading diagonals in a first wave position are often followed by deep second wave corrections, exactly as labeled here. This has a typical look, except for the channel breach on the hourly chart of the channel containing minor wave 5.
If this wave count is correct we should see an increase in upwards momentum for Monday’s session as a minuette degree third wave unfolds. Minuette wave (iii) must make a new high above the end of minuette wave (i) at 1,573.66.
If minuette wave (iii) were to have a Fibonacci ratio to minuette wave (i) it would reach above the target for this movement to end. It may be that minuette wave (iii) does not exhibit a Fibonacci ratio to minuette wave (i), but minuette waves (v) and (iii) do.
Minuette wave (iii) must unfold as a simple impulse, the only possible structure for a third wave.
Any further movement below 1,538.57 would invalidate this wave count at both the hourly and daily chart level. If that were to happen I would struggle to see a viable wave count which could see new highs in the short term.
Alternate Wave Count.
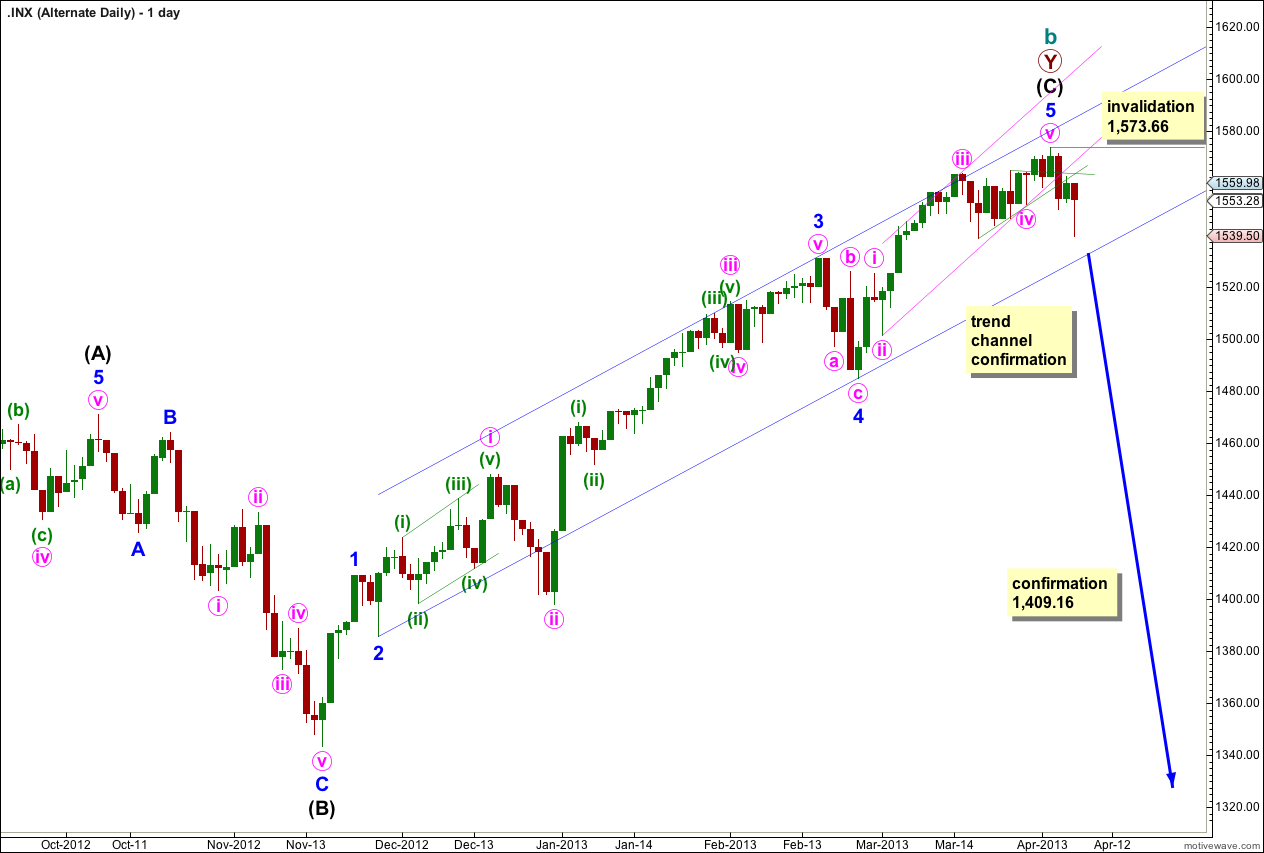
It is possible that we have seen a trend change from the first target zone which was 1,573 to 1,575. Because we have no confirmation of this trend change this will be an alternate wave count.
There is a bearish engulfing candlestick pattern.
Cycle wave c would be extremely likely to take price to new lows below the end of cycle wave a at 666.79, and to last one to several years. Because this is an extremely big trend change it is wise to wait for some confirmation before having any confidence in this wave count.
Initially we need to see the main wave count invalidated with movement below 1,538.57 to have any confidence at all in this wave count. Movement below the channel drawn about intermediate wave (C) would give some more confidence in this wave count.
Final full confirmation would come with price movement below 1,409.16 as at that stage downwards movement could not be just a fourth wave correction within intermediate wave (C) and so it would have to be over.
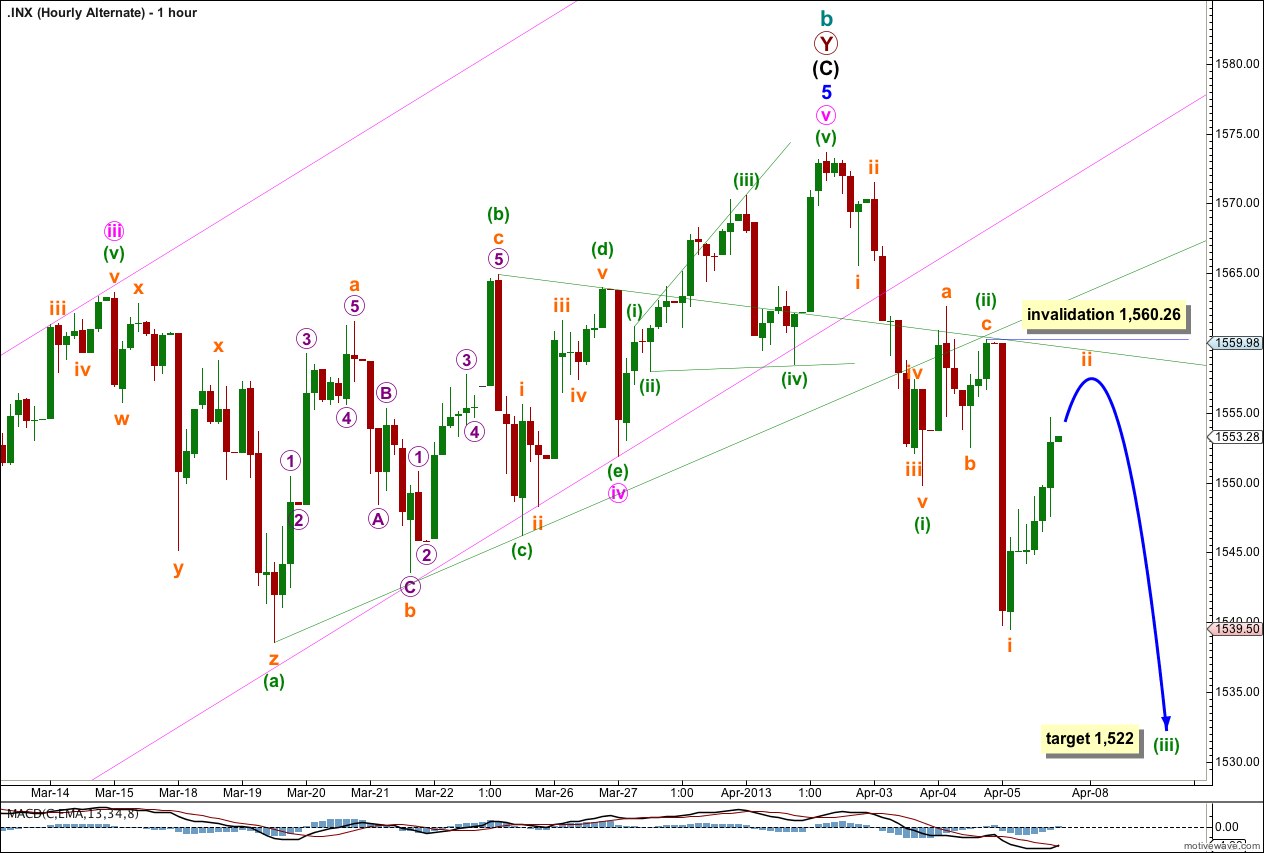
Price did not move higher to start Friday’s session, and minuette wave (ii) ended with a truncated subminuette wave c.
So far upwards movement for subminuette wave ii looks most likely on the five minute chart to be incomplete. I would expect it to move a little higher when markets open for Monday. Thereafter, price is expected to turn downwards strongly with increased downwards momentum for the middle of a third wave.
At 1,522 minuette wave (iii) would reach 1.618 the length of minuette wave (i).
Subminuette wave ii may not move beyond the start of subminuette wave i. This wave count is invalidated with movement above 1,560.26.
If price moves above this point then the downwards movement would have a very strong three wave look to it. It may be a leading diagonal unfolding to the downside, or more likely the main wave count would be correct.
After a diametric (started in Dec. 2012) this next run up has to be a Zigzag, Triangle, or Flat
What is a diametric (in this context)?