
Last analysis of AAPL expected short term downwards movement to a target at 421. Price did move lower but fell 4.25 short of the target.
The wave count remains mostly the same.
The structure for this downwards movement is now clearer and we may now use a parallel channel about it to confirm when it is over. I can now calculate a target for the next wave upwards for you.
Click on the charts below to enlarge.
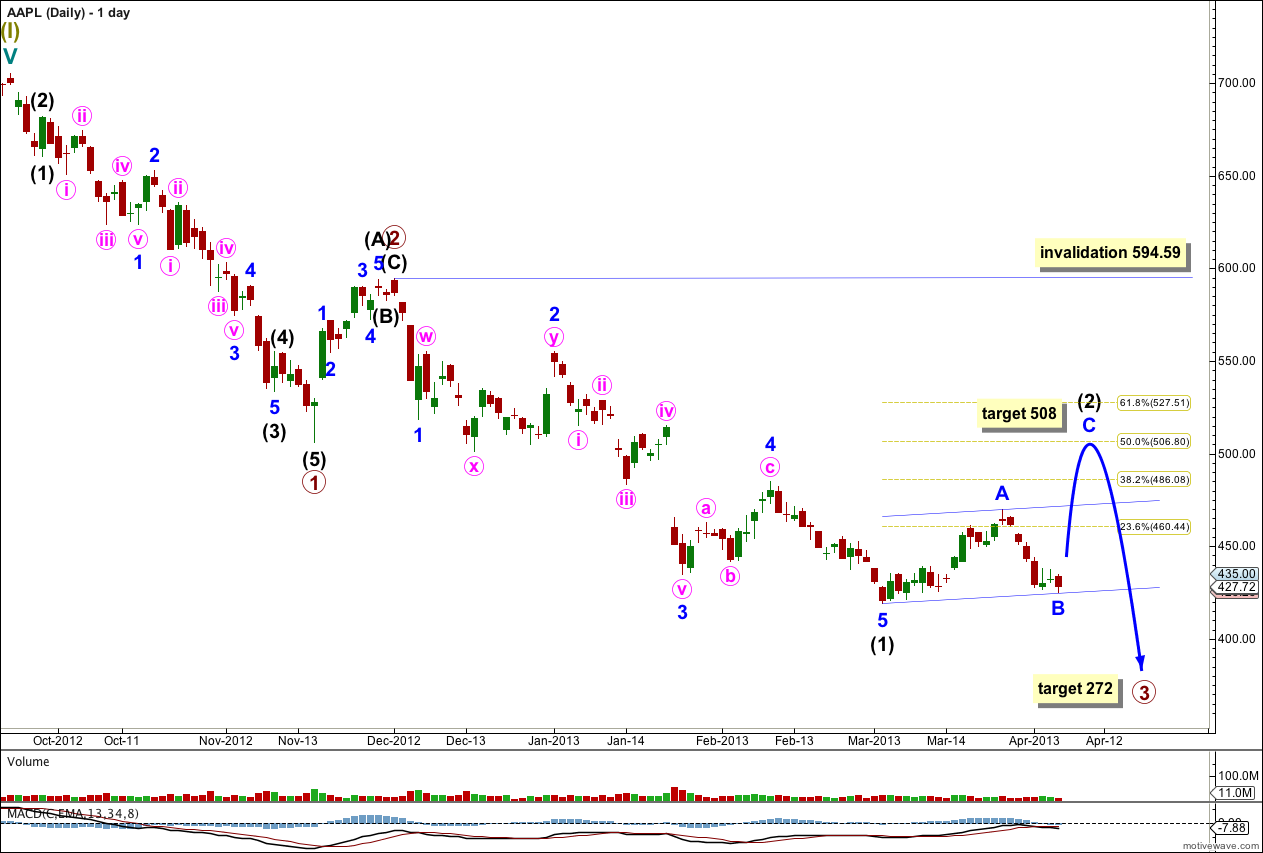
This main wave count expects a five wave impulse for a cycle degree wave a is unfolding to the downside. Within the impulse primary waves 1 and 2 are complete. Primary wave 3 may be extending. Within primary wave 3 intermediate wave (1) is a complete five wave structure and intermediate wave (2) has begun.
I would expect at this early stage for intermediate wave (2) to be relatively deep reaching to about 527.51, the 0.618 Fibonacci ratio of intermediate wave (1).
Intermediate wave (2) may not move beyond the start of intermediate wave (1). This main daily wave count is invalidated with movement above 594.59. If price moves above this point then we may use the alternate wave count below.
At 272 primary wave 3 would reach 1.618 the length of primary wave 1. This long term target is months away.
We can now draw a parallel channel about intermediate wave (2). Draw the first trend line from the start of minor wave A to the end of minor wave B, then place a parallel copy upon the high of minor wave A. Minor wave C may find some resistance about the upper edge of this channel on the way up, if the target is reached this resistance should be broken and the channel may be overshot. When the zigzag for intermediate wave (2) may be seen as complete then subsequent movement below the channel would confirm that the next wave, intermediate wave (3), would be underway.
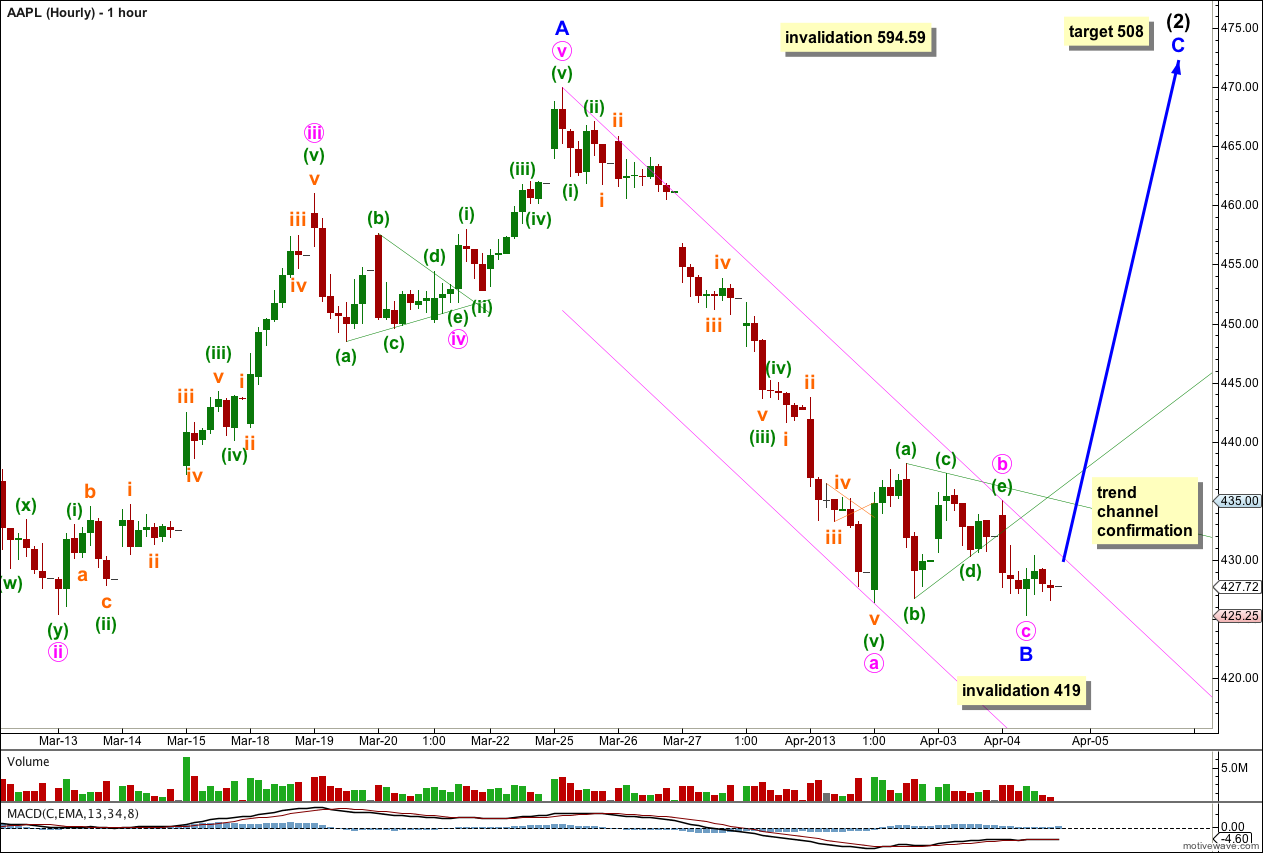
Before price moved lower it moved sideways in a decreasing range for two sessions. This sideways movement subdivides perfectly as a contracting triangle and is a better proportion for minute wave b. Draw a channel about minor wave B: begin with drawing the first trend line from the start of minute wave a to the end of the triangle for minute wave b, then place a parallel copy upon the end of minute wave a. When this channel is clearly breached by upwards movement we may have confidence that minor wave B is over and minor wave C should have begun. At that stage we may have more confidence in the target.
Ratios within minute wave a are: minuette wave (iii) has no Fibonacci ratio to minuette wave (i), and minuette wave (v) is just 1.01 short of 2.618 the length of minuette wave (i).
Ratios within minuette wave (v) are: subminuette wave iii has no Fibonacci ratio to subminuette wave i, and subminuette wave v is just 0.07 longer than 2.618 the length of subminuette wave i.
At 508 minor wave C would reach 1.618 the length of minor wave A and intermediate wave (2) would reach to just above the 50% mark of intermediate wave (1).
Within minor wave A minute wave c is just 0.53 short of 0.236 the length of minute wave a.
If minor wave B moves any lower it may not move beyond the start of minor wave A. This wave count is invalidated at minor wave degree with movement below 419.
Alternate Wave Count.
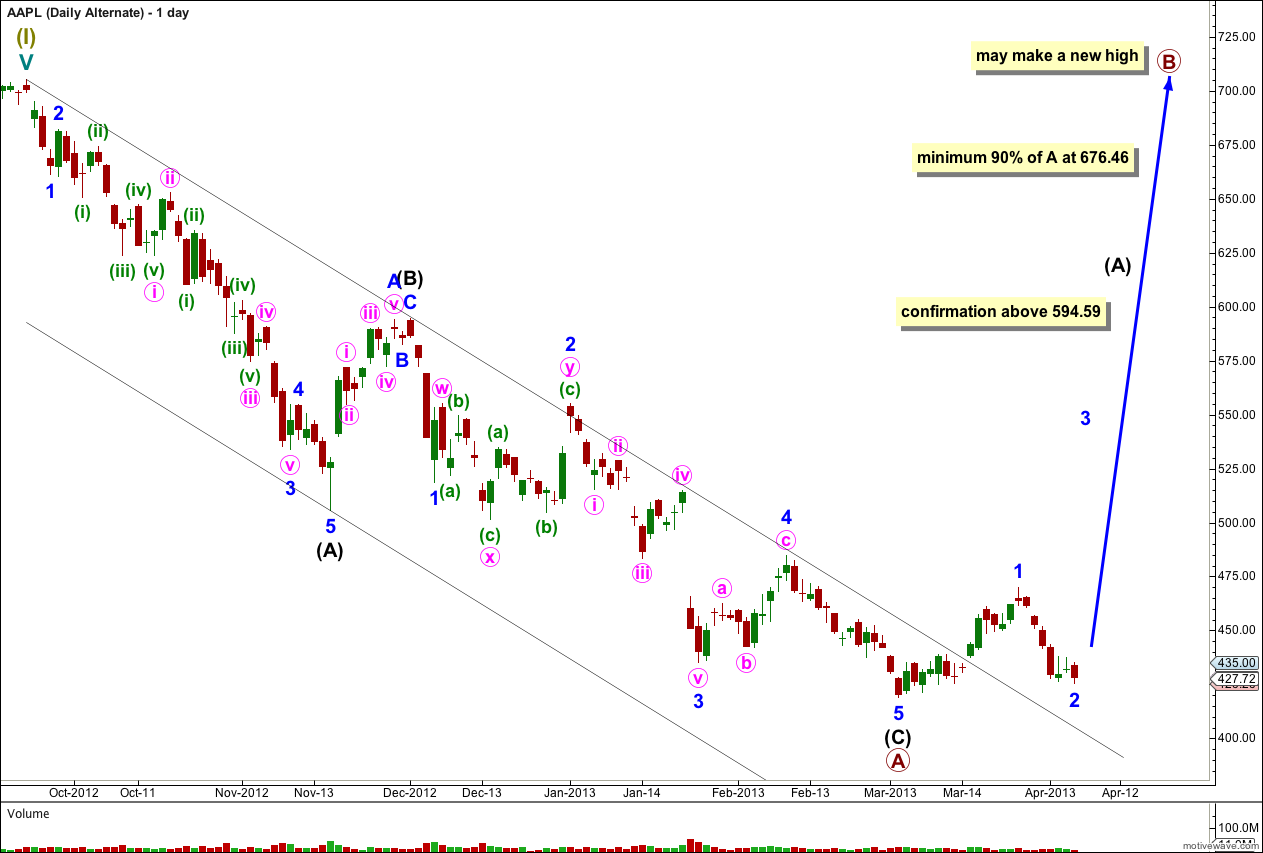
If the main daily wave count is invalidated with upwards movement above 594.59 then this alternate would be confirmed.
If cycle wave a is subdividing into a three wave structure then within it primary wave A may be a complete zigzag. Cycle wave a may be unfolding as a flat correction.
Within primary wave A intermediate waves (A) and (C) have no Fibonacci ratio to each other.
The parallel channel drawn here using Elliott’s technique about a correction is clearly breached by upwards movement. The downwards zigzag is over and an upwards trend has begun.
Primary wave B must subdivide into a three wave structure, most likely a zigzag.
If cycle wave a is a flat correction then primary wave B must reach at least 90% the length of primary wave A at 676.46.
Primary wave B may make a new high above 705.07. Primary wave B should last about six months.