
Last AAPL analysis expected price to move lower to a short term target at 437.5 before turning higher for an upwards correction. Price did move lower to 433.30, 4.2 below the target, and then moved sideways a little. This sideways movement may have been the B wave I was looking out for; it may have been more brief than expected and subdivides nicely into a triangle. Thereafter, price turned lower again.
Click on the charts below to enlarge.
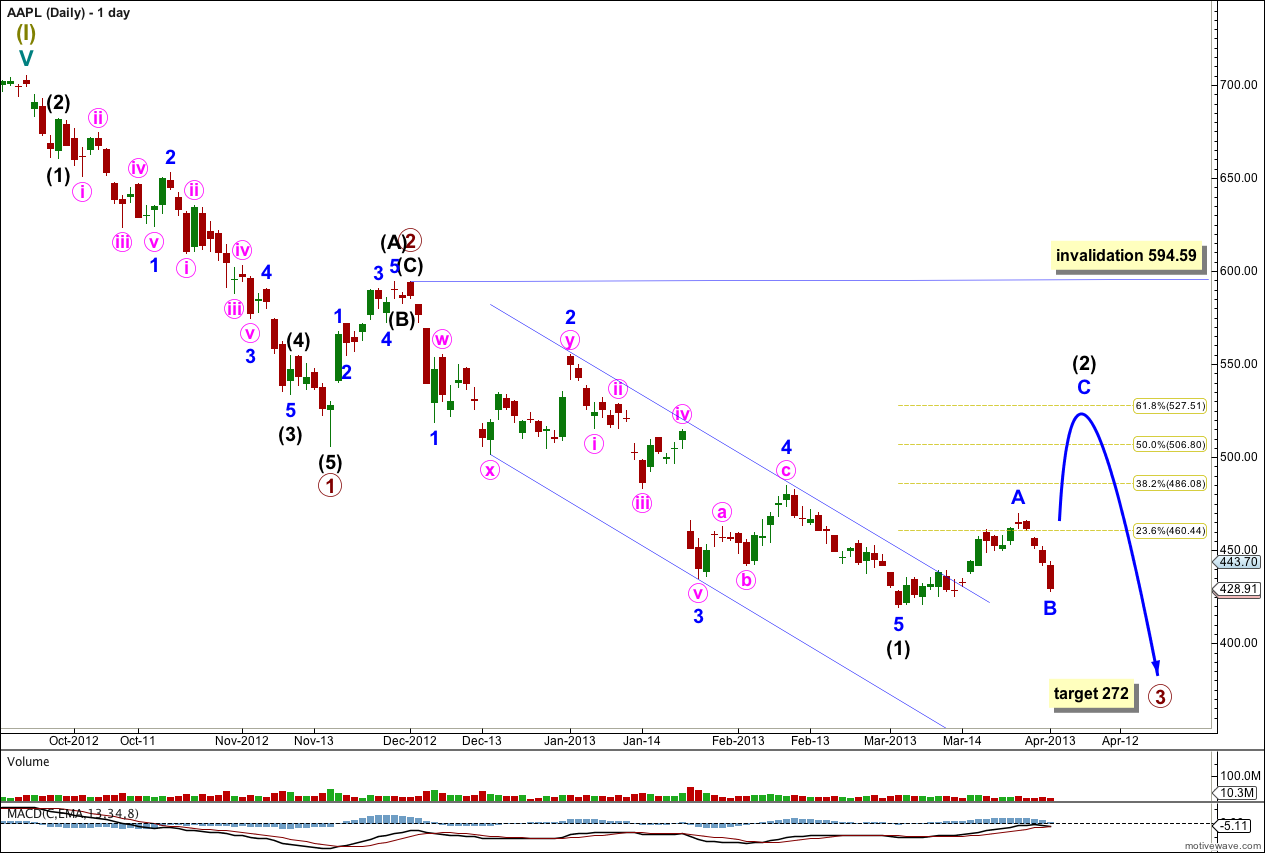
This main wave count expects a five wave impulse for a cycle degree wave a is unfolding to the downside. Within the impulse primary waves 1 and 2 are complete. Primary wave 3 may be extending. Within primary wave 3 intermediate wave (1) is a complete five wave structure and intermediate wave (2) has begun.
I would expect at this early stage for intermediate wave (2) to be relatively deep reaching to about 527.51, the 0.618 Fibonacci ratio of intermediate wave (1).
A parallel channel drawn using Elliott’s channeling technique about intermediate wave (1) is clearly breached by upwards movement. This is trend channel confirmation that for now the downwards movement is over and a new upwards trend has begun.
Intermediate wave (2) may not move beyond the start of intermediate wave (1). This main daily wave count is invalidated with movement above 594.59. If price moves above this point then we may use the alternate wave count below.
At 272 primary wave 3 would reach 1.618 the length of primary wave 1. This long term target is months away.
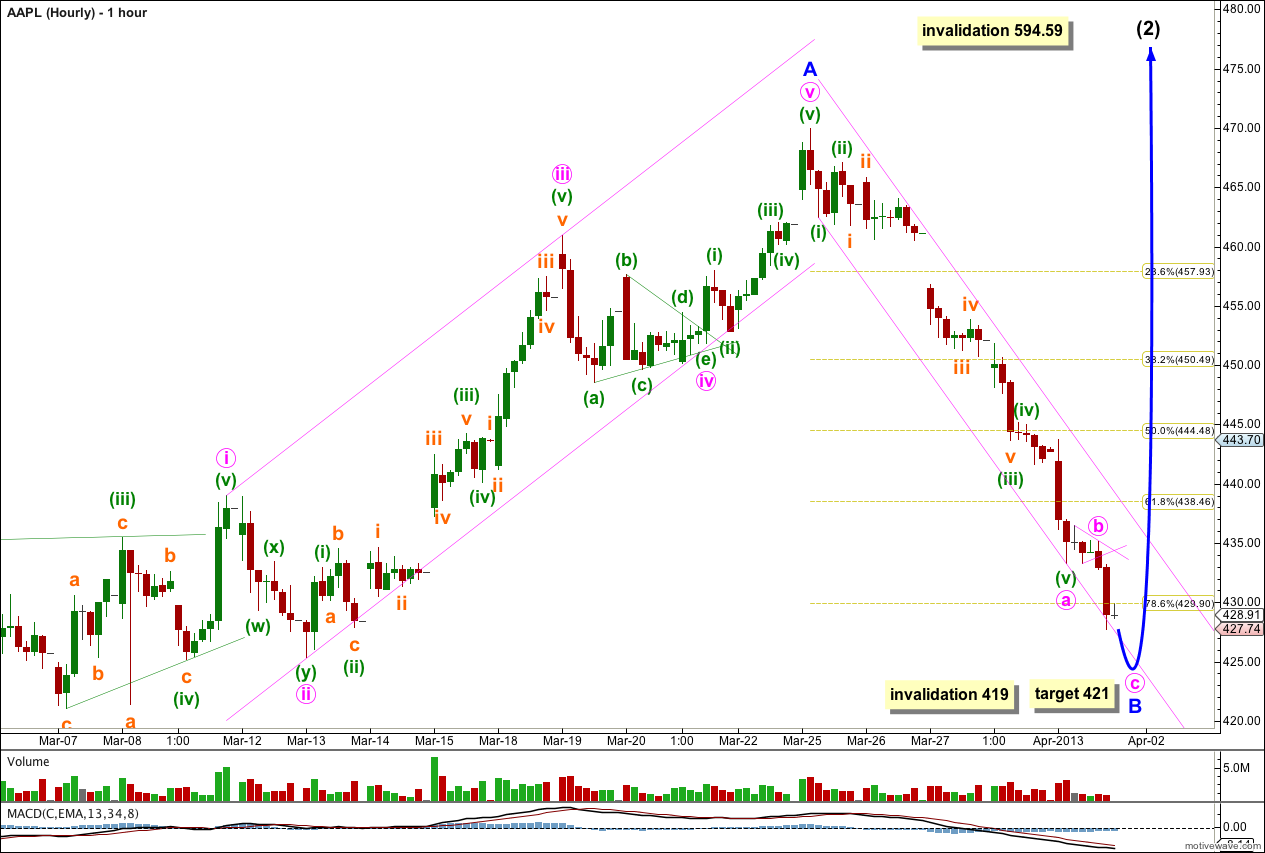
This main hourly wave count has better proportions within minor wave A than the alternate below. It also has better Fibonacci ratios within minor wave A.
Within minor wave A minute wave iii is 3.23 longer than 1.618 the length of minute wave i, and minute wave v is 1.87 short of equality in length with minute wave i. This is a typical relationship between actionary waves of an impulse. Also, minute wave iv ends perfectly on the lower end of a parallel channel drawn using Elliott’s first technique. Minute waves ii and iv are nicely in proportion and show perfect alternation. For these reasons this is my main wave count.
Within intermediate wave (2) upwards movement labeled minor wave A subdivides best as an impulse. This indicates intermediate wave (2) may be unfolding as a zigzag.
Within the zigzag minor wave B must subdivide into a three wave structure. So far it looks like this too may be a zigzag.
Within minor wave B I had expected minute wave b to be higher and longer lasting. It may have been over relatively quickly as a small triangle.
Within minute wave a minuette wave (iii) has no Fibonacci ratio to minuette wave (i), and minuette wave (v) is just 0.43 short of 1.618 the length of minuette wave (i).
Within minuette wave (iii) subminuette wave iii is 0.73 shorter than 2.618 the length of subminuette wave i, and subminuette wave v has no Fibonacci ratio to either of subminuette waves i or iii.
At 421 minute wave c would reach 0.382 the length of minute wave a. When the best fit parallel channel drawn here about minor wave B is breached by upwards movement then we shall have an indication that minor wave B is complete and minor wave C upwards has begun. Minor wave C is highly likely to make a new high above the end of minor wave A.
Minor wave B may not move beyond the start of minor wave A. This main hourly wave count is invalidated with movement below 419. If this main hourly wave count is invalidated then the alternate below may be used.
Alternate Hourly Wave Count.
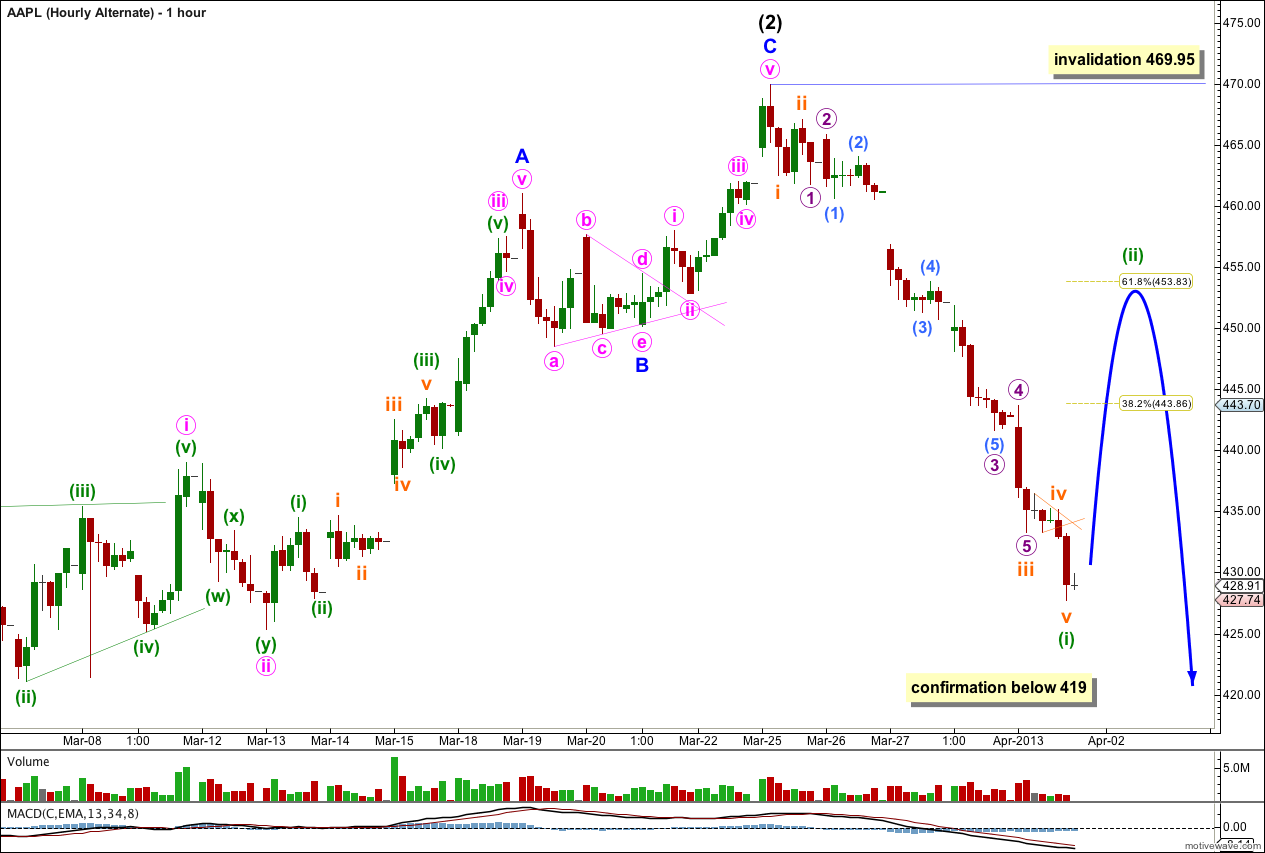
It is possible to see upwards movement for intermediate wave (2) as a complete zigzag.
Within intermediate wave (2) there is no Fibonacci ratio between minor waves A and C.
Within minor wave A minute waves i and iii are out of proportion. Minute wave iii is 0.41 short of 1.618 the length of minute wave i, and minute wave v has no Fibonacci ratio to either of minute waves i and iii.
If price moves below 419 this alternate may be correct.
So far to the downside we may have a complete impulse and a second wave correction may be expected. Minuette wave (ii) may end about the 0.618 Fibonacci ratio of minuette wave (i) at 453.83.
Minuette wave (ii) may not move beyond the start of minuette wave (i). This alternate is invalidated with movement above 469.95.
Alternate Daily Wave Count.
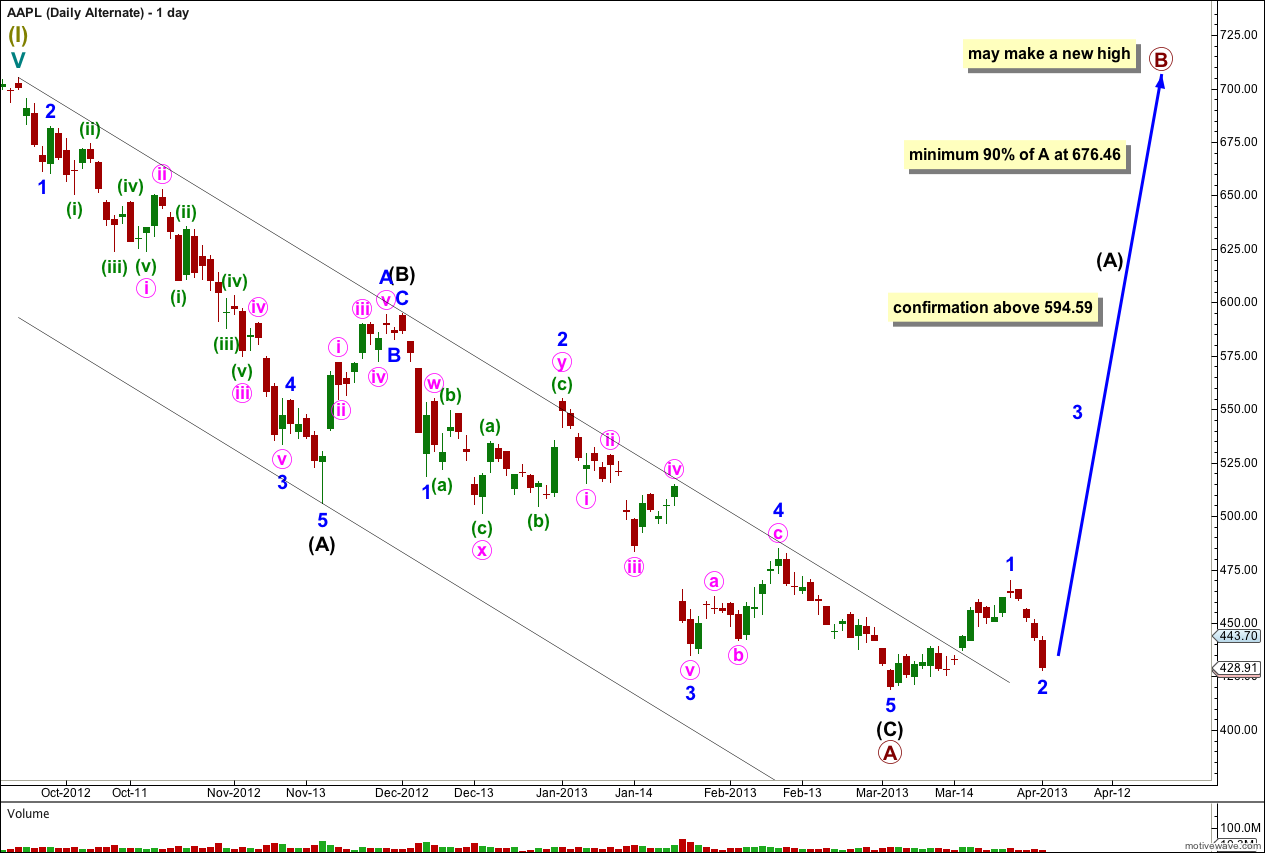
If the main daily wave count is invalidated with upwards movement above 594.59 then this alternate would be confirmed.
If cycle wave a is subdividing into a three wave structure then within it primary wave A may be a complete zigzag. Cycle wave a may be unfolding as a flat correction.
Within primary wave A intermediate waves (A) and (C) have no Fibonacci ratio to each other.
The parallel channel drawn here using Elliott’s technique about a correction is clearly breached by upwards movement. The downwards zigzag is over and an upwards trend has begun.
Primary wave B must subdivide into a three wave structure, most likely a zigzag.
If cycle wave a is a flat correction then primary wave B must reach at least 90% the length of primary wave A at 676.46.
Primary wave B may make a new high above 705.07. Primary wave B should last about six months.