
Yesterday’s analysis expected Wednesday’s session to begin with a little upwards movement to a short term target at 1,568 before price dropped lower. This is not what happened as the session began with downwards movement, but price has remained well above the invalidation point on the hourly chart and the wave count remains the same.
I have a new hourly alternate for you today.
Click on the charts below to enlarge.
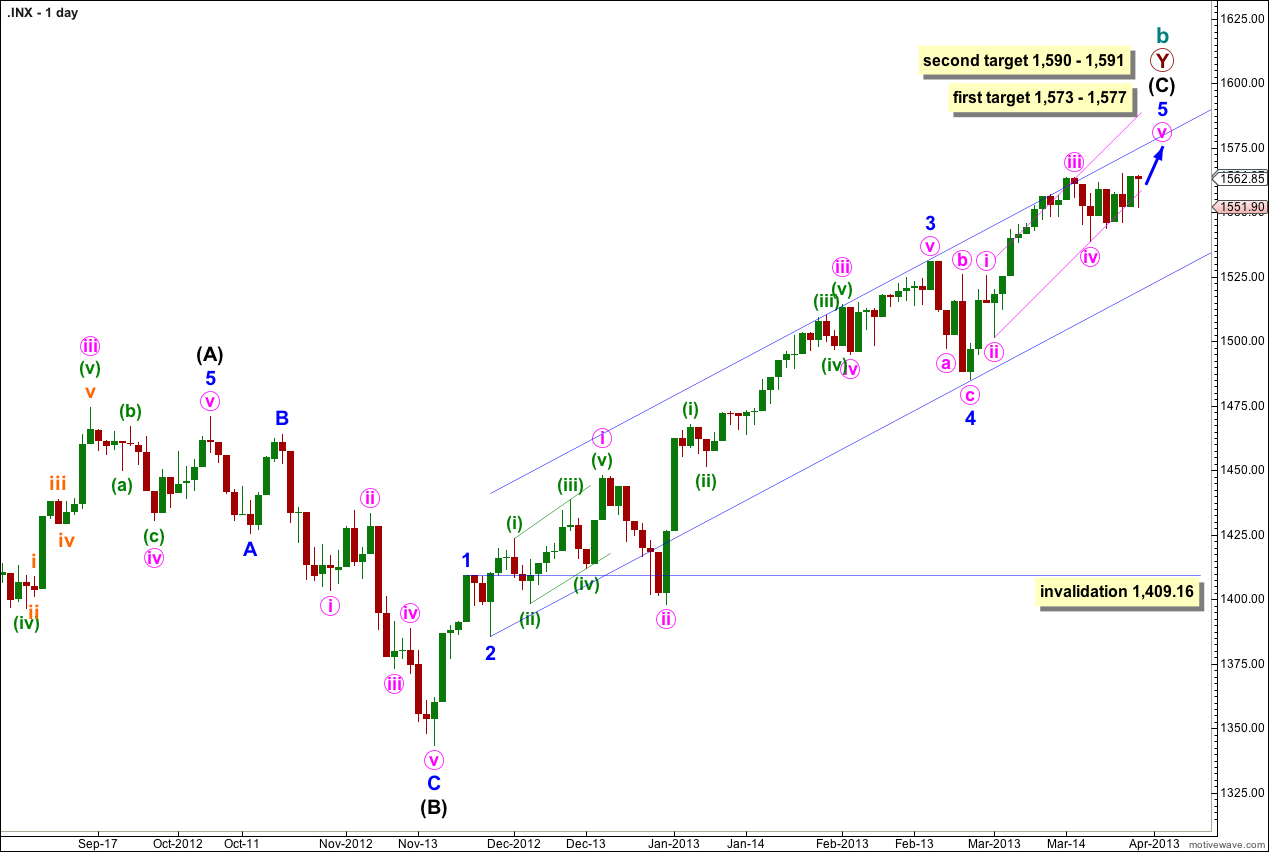
The structure is within the second zigzag of a double labeled primary wave Y. Within this second zigzag intermediate wave (C) may be incomplete.
Within intermediate wave (C) minor waves 1 through to 4 are most likely complete. We may use Elliott’s channeling technique to draw a channel about the impulse of intermediate wave (C). Draw the first trend line from the lows of minor waves 2 to 4, then place a parallel copy upon the high of minor wave 3. At this stage it looks like minor wave 5 may end about the upper edge of this channel.
At 1,573 cycle wave b would reach 105% the length of cycle wave a. This is the minimum requirement for a B wave in relation to an A wave within an expanded flat, and as expanded flats are the most common type of flat this price point has a good probability of being reached.
At 1,575 minor wave 5 would reach 0.618 the length of minor wave 3.
At 1,577 minute wave v within minor wave 5 would reach 0.618 the length of minute wave iii.
If price continues to move higher through the first target then we may use the second target. At 1,590 intermediate wave (C) would reach 0.618 the length of intermediate wave (A). At 1,591 minor wave 5 would reach 1.618 the length of minor wave 1. This gives us a high probability two point target based upon three wave degrees.
Within intermediate wave (C) minor wave 4 may not move into minor wave 1 price territory. This wave count is invalidated with movement below 1,409.16.
Within intermediate wave (C) minor wave 1 has no Fibonacci duration lasting 4 days, minor wave 2 lasted a Fibonacci 3 days, minor wave 3 lasted a Fibonacci 55 days, and minor wave 4 lasted a Fibonacci 5 days. So far minor wave 5 has lasted 21 days and may be almost complete. One more session would see it close enough to a Fibonacci duration to have a relationship. If it does not end here then a further 13 sessions would take it to a Fibonacci 34. At each Fibonacci time duration I will look at the structure to see if it could be complete and if so we shall have an alternate wave count for that possibility.
At intermediate degree wave (C) has so far lasted 88 sessions. In another 1 session it will have lasted a Fibonacci 89.
The most likely end to this trend may be tomorrow. However, Fibonacci time relationships are not always reliable. This is a guideline only!
If this trend does not end this week on the 27th of March the next possible Fibonacci date would be 17th April. Alternatively, it may end with no Fibonacci time relationships within the final waves.
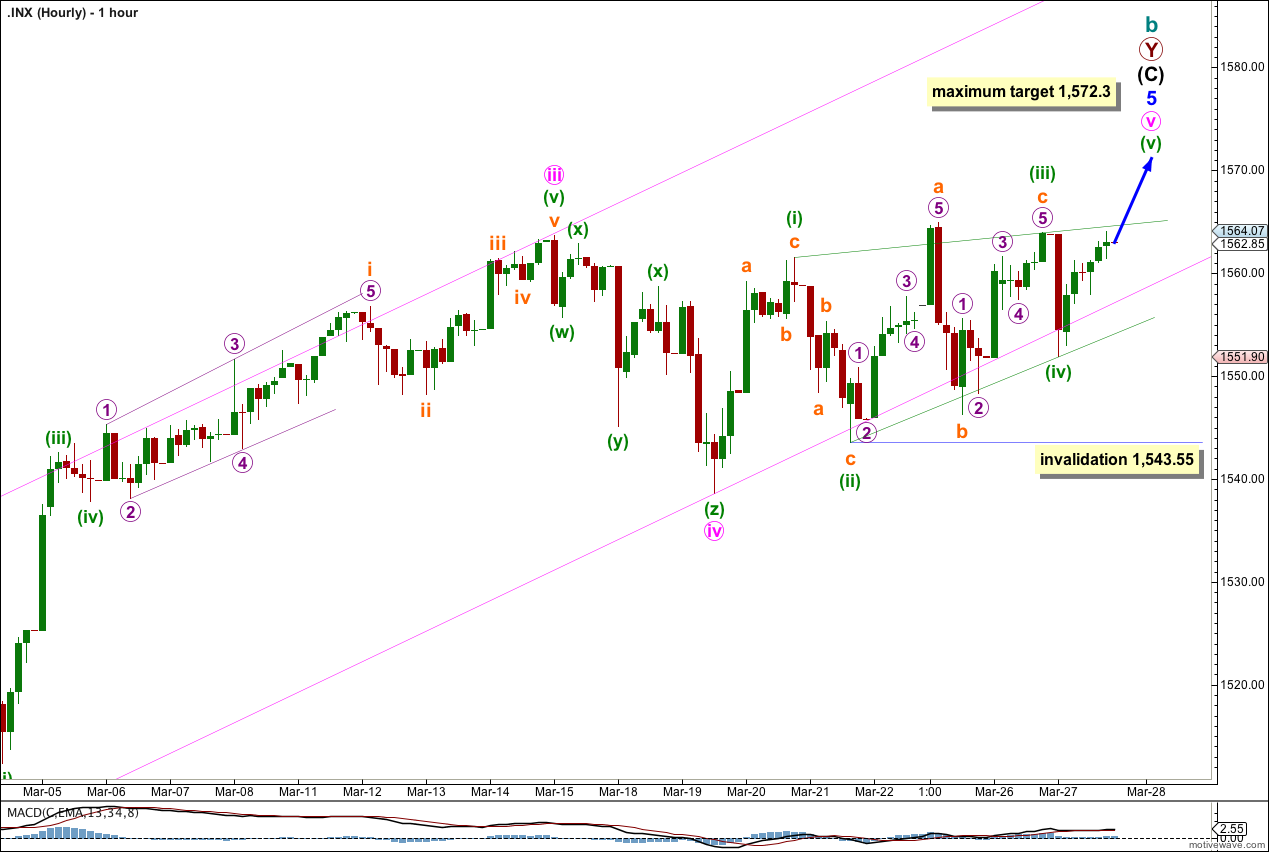
With price failing to move a little higher the zigzag of minuette wave (iii) may have a slightly truncated subminuette wave c.
Minuette wave (iii) is shorter than minuette wave (i) so the diagonal is contracting.
Minuette wave (iv) may be over here, or this may be only subminuette wave a within it. On the five and one minute charts this movement is a sheer drop down and subdivisions are not clear. It may be either a three or a five. Because minuette wave (iii) is shorter than minuette wave (i) I expect that this is the end to minuette wave (iv) because this would see it shorter than minuette wave (ii).
The third wave may not be the shortest. This gives a limit to upwards movement for minuette wave (v) at no higher than 1,572.3. Minuette wave (v) should subdivide into a zigzag and may be almost complete.
If price moves above 1,572.3 we should use the alternate hourly wave count below.
If minuette wave (iv) moves any lower it may not move beyond the end of minuette wave (ii) below 1,543.55.
If we see a little more upwards movement tomorrow which ends before 1,572.3 and then price turns lower we shall have the first indication of a trend change (at least short term) with subsequent movement below 1,543.55.
Alternate Hourly Wave Count.
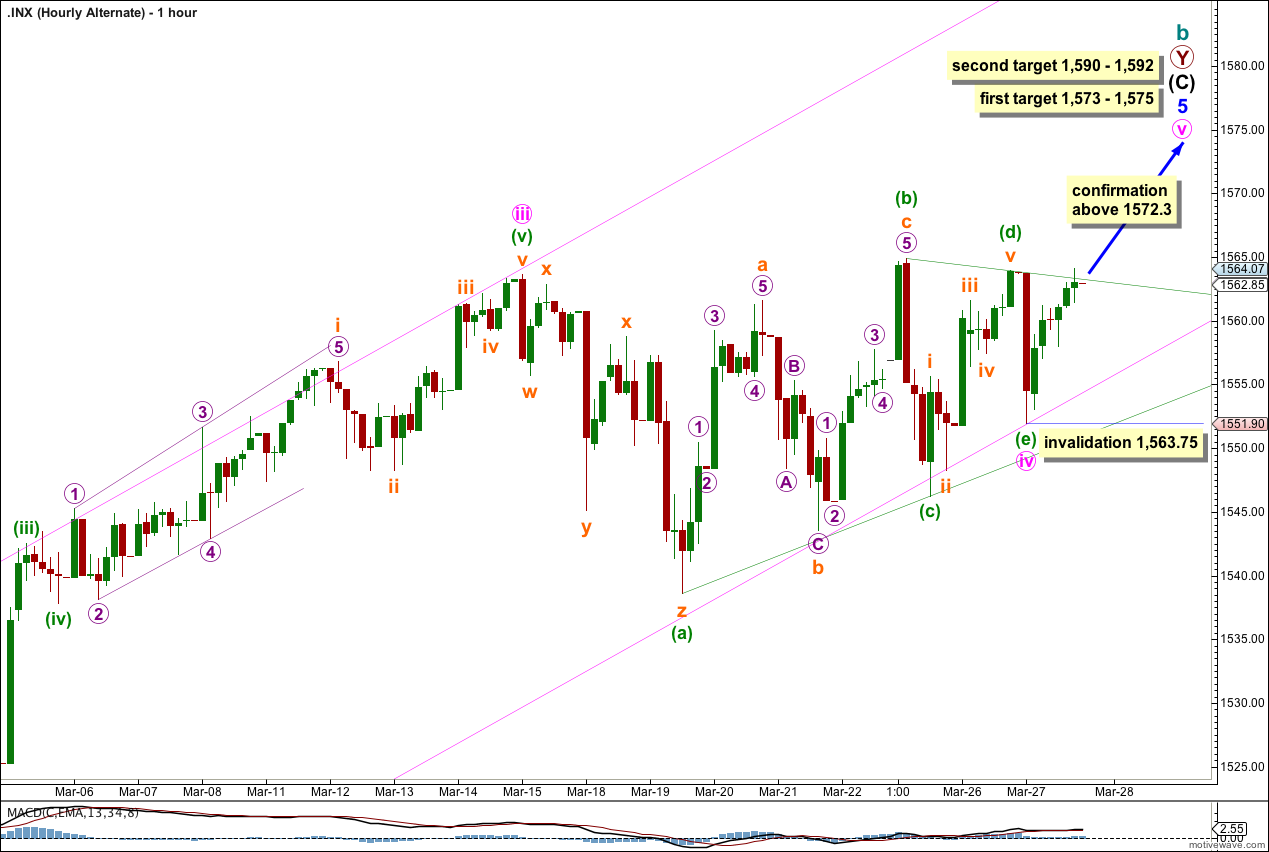
It is also possible that minute wave iv just completed as a contracting running triangle.
The target remains mostly the same. For the first lower target at 1,575 minute wave v would reach equality in length with minute wave iii.
If minor waves 5 and intermediate wave (C) are to have Fibonacci time relationships then this final upwards wave for minute wave v may only reach the first target and take just one day to unfold.
Alternatively, minor wave 5 and intermediate wave (C) may not have Fibonacci time relationships, and minute wave v may take a few days to complete.
Within minute wave v no second wave correction may move beyond the start of the first wave. This alternate is invalidated with movement below 1,563.75.
Hi Lara, your invalidation point on the alternate chart possibly should be around 1551.90 rather than 1563.75.
Thank you, yes, you’re right.
Should be 1,551.90.