
Yesterday’s analysis expected upwards movement towards a short term target at 1,568. Price has moved higher but has not yet reached the target.
The wave count remains the same with just the one daily and one hourly chart at this stage.
Click on the charts below to enlarge.
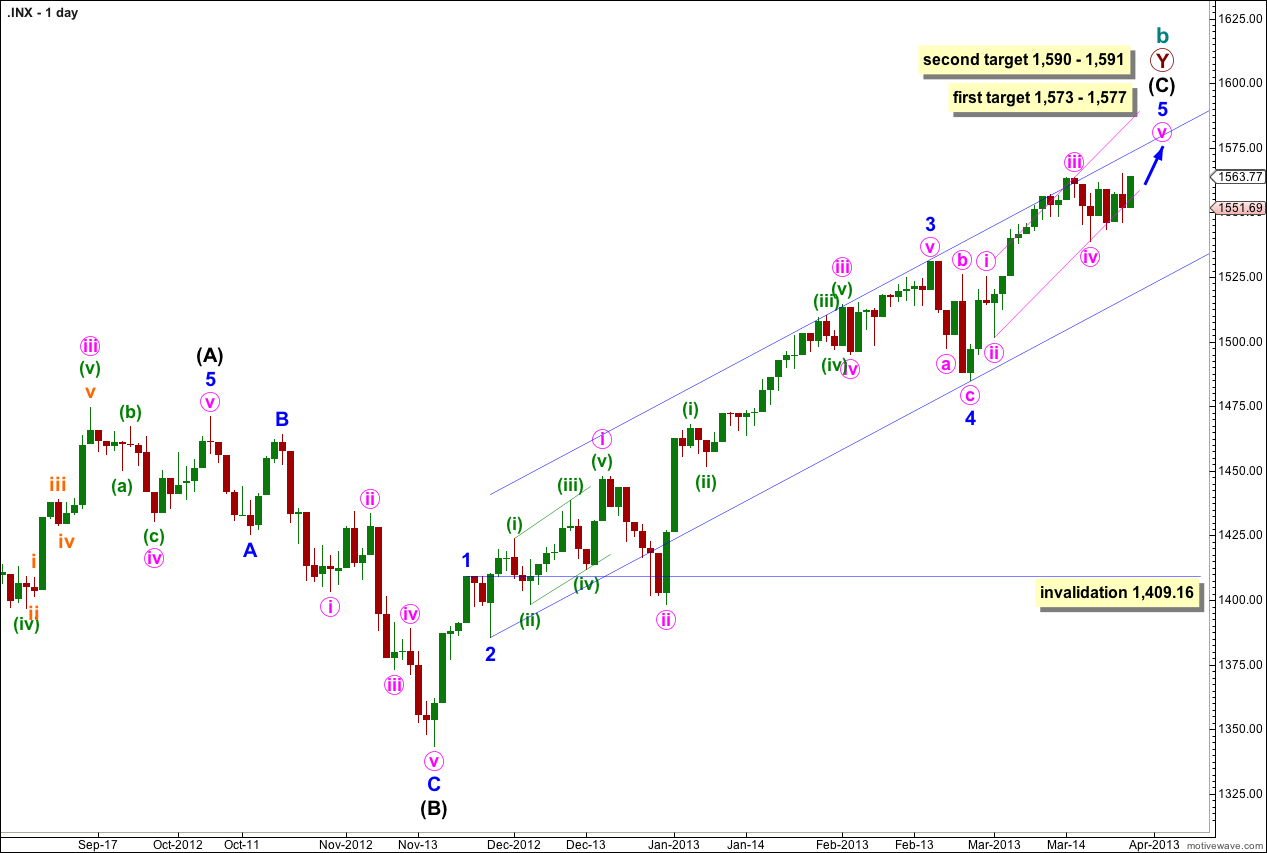
The structure is within the second zigzag of a double labeled primary wave Y. Within this second zigzag intermediate wave (C) may be incomplete.
Within intermediate wave (C) minor waves 1 through to 4 are most likely complete. We may use Elliott’s channeling technique to draw a channel about the impulse of intermediate wave (C). Draw the first trend line from the lows of minor waves 2 to 4, then place a parallel copy upon the high of minor wave 3. At this stage it looks like minor wave 5 may end about the upper edge of this channel.
At 1,573 cycle wave b would reach 105% the length of cycle wave a. This is the minimum requirement for a B wave in relation to an A wave within an expanded flat, and as expanded flats are the most common type of flat this price point has a good probability of being reached.
At 1,575 minor wave 5 would reach 0.618 the length of minor wave 3.
At 1,577 minute wave v within minor wave 5 would reach 0.618 the length of minute wave iii.
If price continues to move higher through the first target then we may use the second target. At 1,590 intermediate wave (C) would reach 0.618 the length of intermediate wave (A). At 1,591 minor wave 5 would reach 1.618 the length of minor wave 1. This gives us a high probability two point target based upon three wave degrees.
Within intermediate wave (C) minor wave 4 may not move into minor wave 1 price territory. This wave count is invalidated with movement below 1,409.16.
Within intermediate wave (C) minor wave 1 has no Fibonacci duration lasting 4 days, minor wave 2 lasted a Fibonacci 3 days, minor wave 3 lasted a Fibonacci 55 days, and minor wave 4 lasted a Fibonacci 5 days. So far minor wave 5 has lasted 19 days and may be incomplete. A possible end may be at a Fibonacci 21 days which will be in another 2 sessions. If it does not end there then a further 13 sessions would take it to a Fibonacci 34. At each Fibonacci time duration I will look at the structure to see if it could be complete and if so we shall have an alternate wave count for that possibility.
At intermediate degree wave (C) has so far lasted 86 sessions. In another 3 sessions it will have lasted a Fibonacci 89.
The most likely end to this trend may be 27th March, 2013 (give or take one day either side). However, Fibonacci time relationships are not always reliable. This is a guideline only!
If this trend does not end this week on the 27th of March the next possible Fibonacci date would be 17th April. Alternatively, it may end with no Fibonacci time relationships within the final waves.
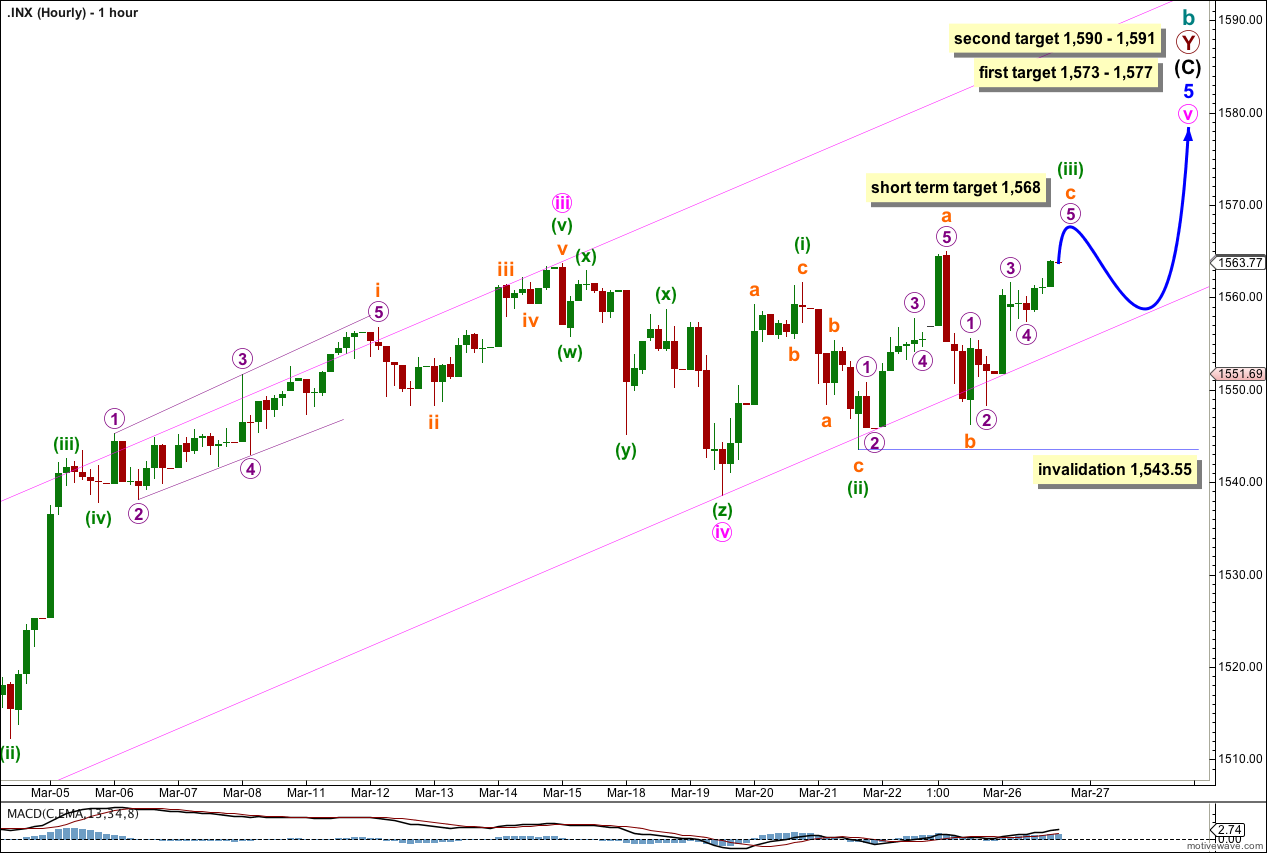
It looks most likely that the fifth wave may be unfolding as an ending diagonal. All the subwaves must subdivide into zigzags.
Within the zigzag of minuette wave (iii) at 1,568 subminuette wave c would reach equality with subminuette wave a.
Within subminuette wave c there is no Fibonacci ratio between micro waves 1 and 3. This makes it more likely we shall see a Fibonacci ratio between micro wave 5 and either of 1 or 3. At 1,568 micro wave 5 would reach equality with micro wave 3. This target has a good probability.
When a little more upwards movement ends minuette wave (iii) then the following zigzag downwards for minuette wave (iv) must overlap minuette wave (i) price territory, but may not move beyond the end of minuette wave (ii). This zigzag down must end below 1,561.56 but may not move below 1,543.55. It will probably find some support about the lower end of the parallel channel.
Thereafter, a final zigzag upwards may take price up to one of the target zones.
What are the probability at the end of this five waves up (your Wave (iii) green) could be the same as an end of Major Wave (3) and we drop 5o points?
For that to be the end of a third wave… it does not have the right look.
For me to see what you mean in the larger picture I need a chart.