
Last analysis expected to see upwards movement for Friday and price has moved higher. However, I had expected to see a new high which did not happen.
Sideways movement over most of this week indicates a triangle unfolding. If this structure remains valid then we can know with a high probability that price will exit the triangle in the same direction it entered.
Click on the charts below to enlarge.
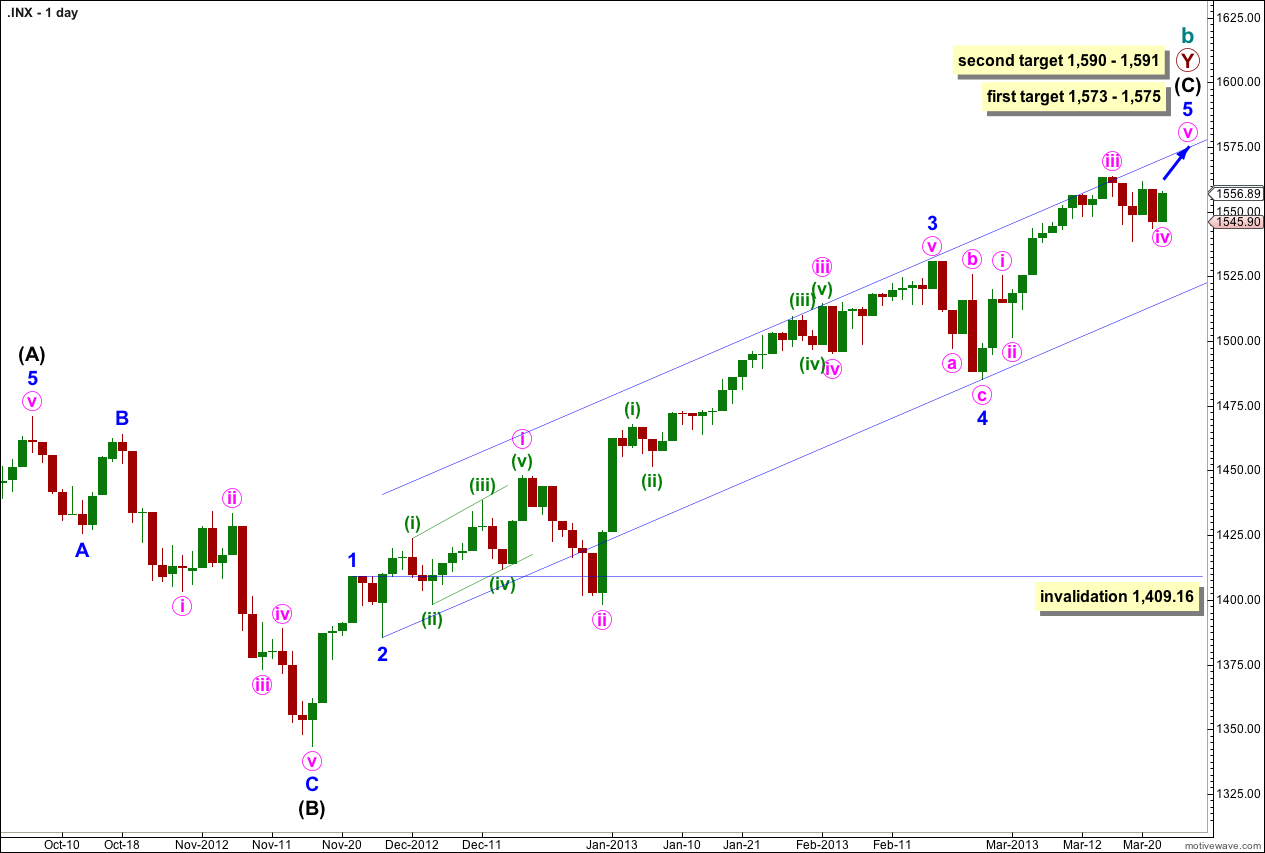
The structure is within the second zigzag of a double labeled primary wave Y. Within this second zigzag intermediate wave (C) may be incomplete.
Within intermediate wave (C) minor waves 1 through to 4 are most likely complete. We may use Elliott’s channeling technique to draw a channel about the impulse of intermediate wave (C). Draw the first trend line from the lows of minor waves 2 to 4, then place a parallel copy upon the high of minor wave 3. At this stage it looks like minor wave 5 may end about the upper edge of this channel.
At 1,573 cycle wave b would reach 105% the length of cycle wave a. This is the minimum requirement for a B wave in relation to an A wave within an expanded flat, and as expanded flats are the most common type of flat this price point has a good probability of being reached.
At 1,575 minor wave 5 would reach 0.618 the length of minor wave 3.
If price continues to move higher through the first target then we may use the second target. At 1,590 intermediate wave (C) would reach 0.618 the length of intermediate wave (A). At 1,591 minor wave 5 would reach 1.618 the length of minor wave 1. This gives us a high probability two point target based upon three wave degrees.
Within intermediate wave (C) minor wave 4 may not move into minor wave 1 price territory. This wave count is invalidated with movement below 1,409.16.
Within intermediate wave (C) minor wave 1 has no Fibonacci duration lasting 4 days, minor wave 2 lasted a Fibonacci 3 days, minor wave 3 lasted a Fibonacci 55 days, and minor wave 4 lasted a Fibonacci 5 days. So far minor wave 5 has lasted 17 days and may be incomplete. A possible end may be at a Fibonacci 21 days which will be in another 3 sessions. If it does not end there then a further 13 sessions would take it to a Fibonacci 34. At each Fibonacci time duration I will look at the structure to see if it could be complete and if so we shall have an alternate wave count for that possibility.
At intermediate degree wave (C) has so far lasted 84 sessions. In another 4 sessions it will have lasted a Fibonacci 89.
The most likely end to this trend may be 27th March, 2013 (give or take one day either side). However, Fibonacci time relationships are not always reliable. This is a guideline only.
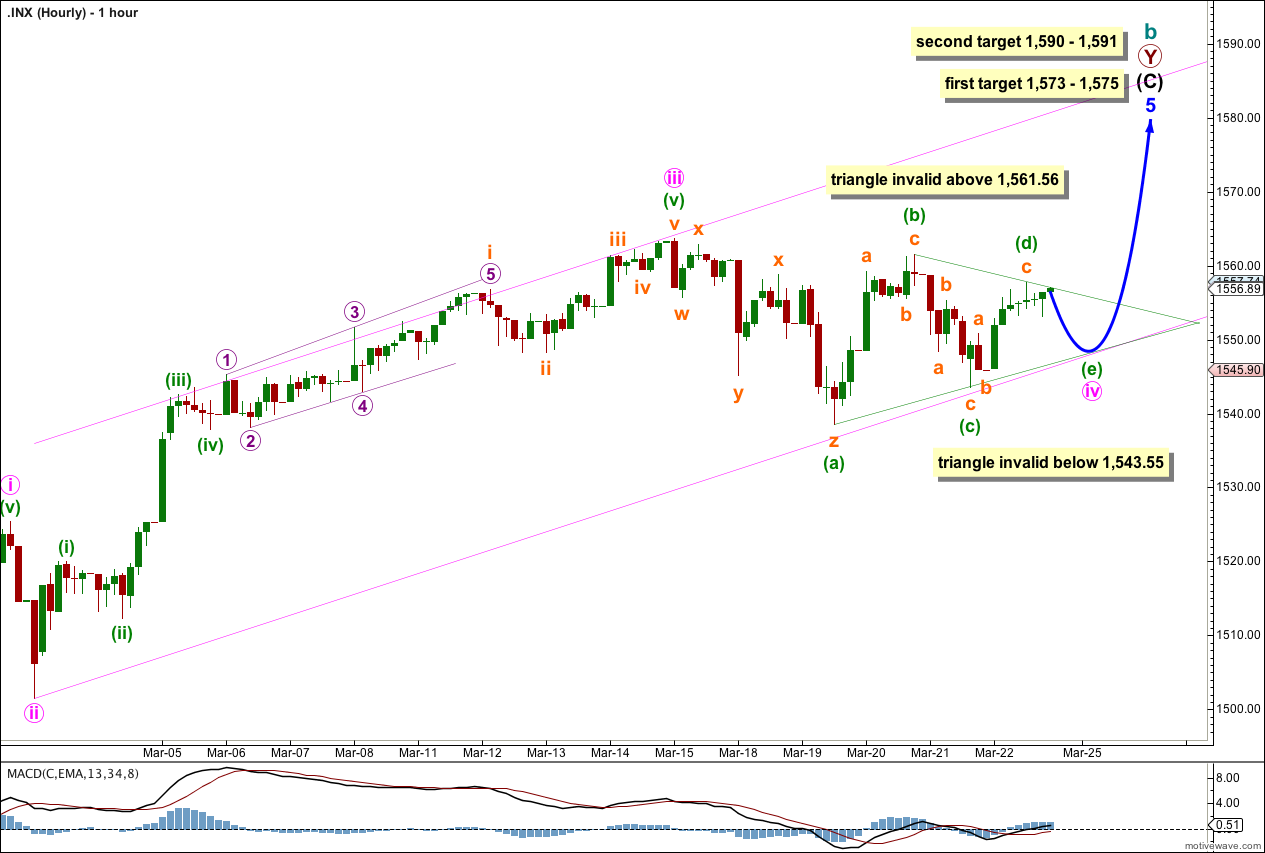
Sideways movement looks very much like a fourth wave triangle. Subdivisions for this wave count have a good fit on the five minute chart.
For the triangle to remain valid any further movement of minuette wave (d) may not move beyond the end of minuette wave (b) at 1,561.56 (before downwards movement for minuette wave (e)).
Minuette wave (e) may not move beyond the end of minuette wave (c) below 1,543.55.
If the triangle remains valid then we have a high probability movement upwards in a sharp thrust out of the triangle.
When the triangle is completed then I will use the ratio between minute waves i, iii and v to see if there is a convergence in calculations with existing targets at other wave degrees.
When the triangle is complete draw the parallel channel about minor wave 5. Draw the first trend line from the lows of minute wave ii to the end of the triangle minute wave iv, then place a parallel copy upon the high of minute wave iii. Expect minute wave v to end either mid way within the channel, or to find resistance about the upper edge.
When the channel is subsequently breached by downwards movement we shall have a first indication that upwards movement may be over.
If price moves below 1,543.55 we may use the alternate below.
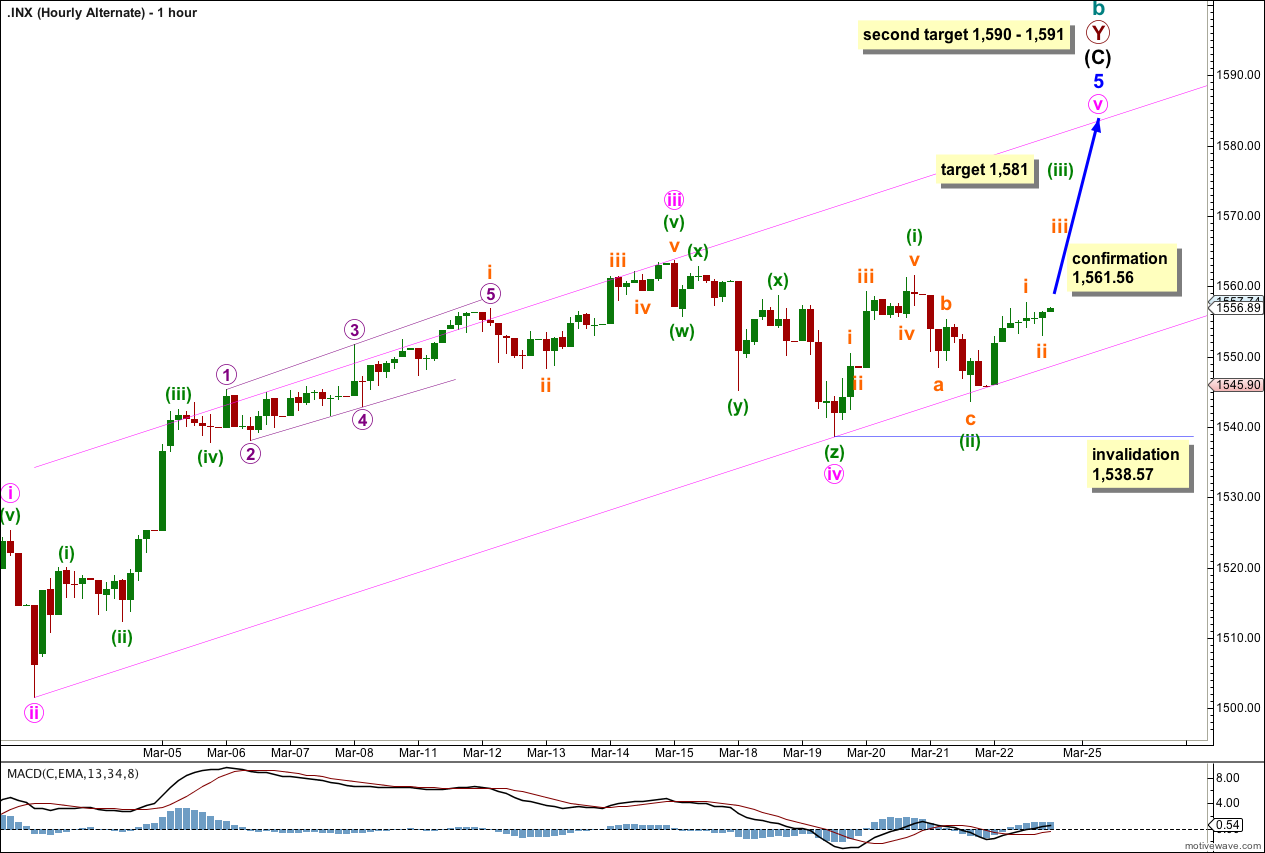
I have seen enough structures over the years unfold looking very much like triangles to invalidate the triangle and turn out to be something else, either a combination or series of first and second waves, to know to look out for this alternate.
The subdivisions of these recent movements are ambiguous. We may be looking at a series of overlapping first and second waves. If this is correct then we should expect to see an increase in upwards momentum on Monday or Tuesday as the middle of a third wave unfolds.
At 1,581 minuette wave (ii) would reach 1.618 the length of minuette wave (i). This fits with the second higher target for upwards movement to end.
If minuette wave (ii) moves lower it may not move beyond the start of minuette wave (i). This wave count is invalidated with movement below 1,538.57.
Alternate Daily Wave Count.
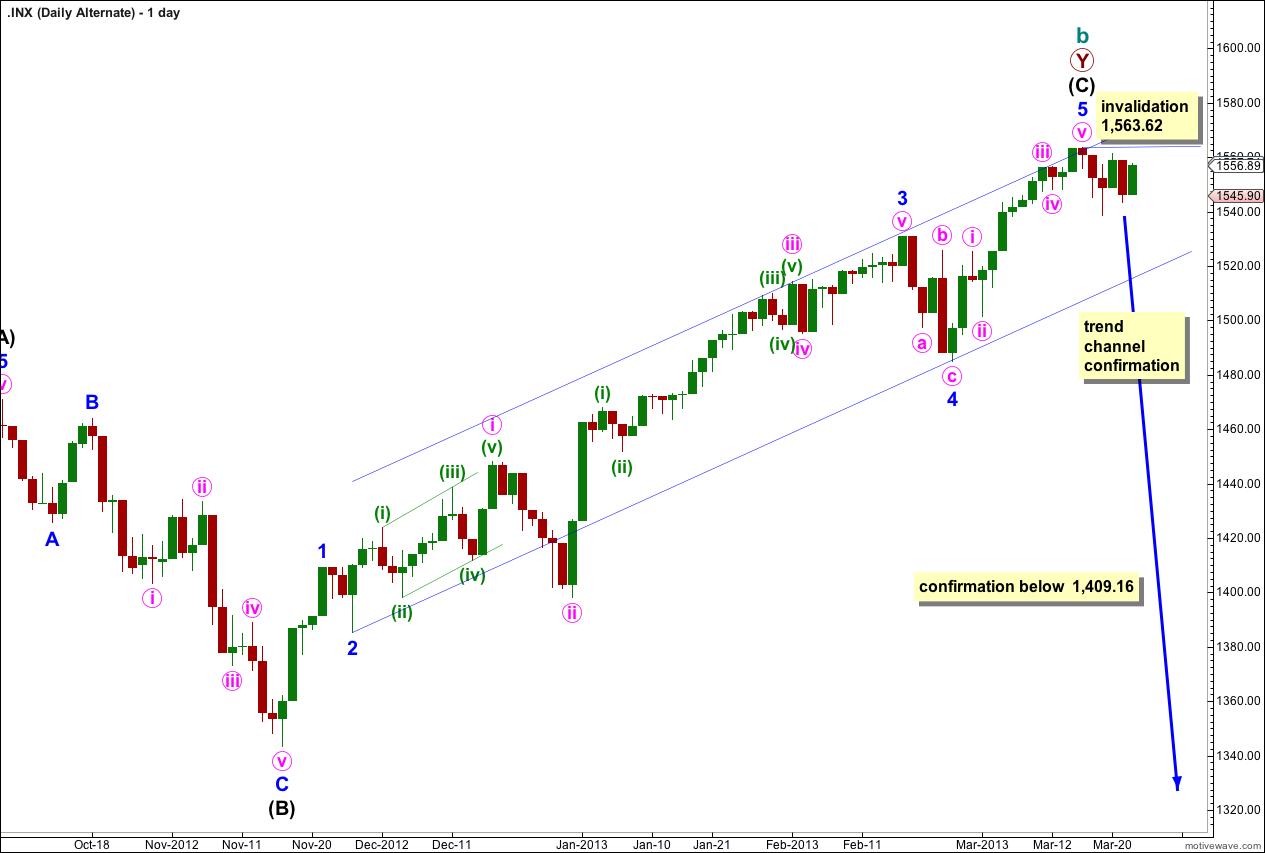
We may consider the possibility that we have seen a trend change at cycle degree just over a week ago.
We would need to see movement below the blue parallel channel about intermediate wave (C) to have a little confidence in this wave count. At this stage it is just a possibility to be aware of; we have zero confirmation of a trend change.
We should always assume the trend remains the same until proven otherwise. At this stage we should assume the trend remains upwards, until we have confirmation that it has changed.
Any movement above 1,563.62 immediately invalidates this wave count and would give us more confidence in the targets on the main wave count.
Movement below 1,409.16 would provide confidence in a trend change. At that stage downwards movement could not be just a fourth wave correction within the last upwards wave, and so intermediate wave (C) would have to be over.
“I have seen enough structures over the years unfold looking very much like triangles to invalidate the triangle and turn out to be something else, either a combination or series of first and second waves, to know to look out for this alternate.” — Agreed looking for 1590