
Last analysis of AAPL expected downwards and sideways movement to reach to about 445.20 in about one or two sessions. Price moved lower and has reached 448.50, 3.3 short of the target. Sideways movement lasted a bit longer than two sessions.
The wave count is the same. I am expecting an interruption to this upwards trend as a B wave unfolds downwards. This is unlikely to make a new low.
Click on the charts below to enlarge.
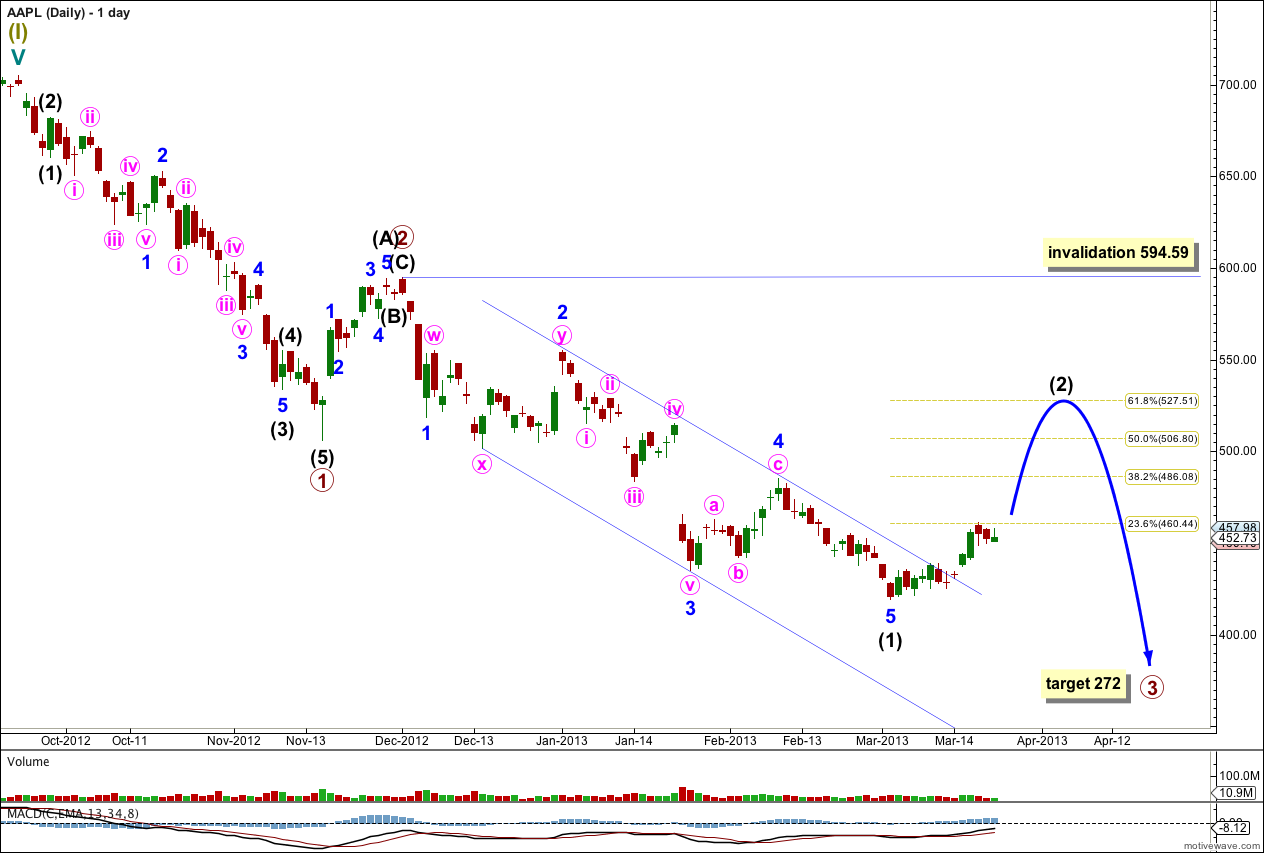
This main wave count expects a five wave impulse for a cycle degree wave a is unfolding to the downside. Within the impulse primary waves 1 and 2 are complete. Primary wave 3 may be extending. Within primary wave 3 intermediate wave (1) is a complete five wave structure and intermediate wave (2) may have just begun.
I would expect at this early stage for intermediate wave (2) to be relatively deep reaching to about 527.51 the 0.618 Fibonacci ratio of intermediate wave (1).
A parallel channel drawn using Elliott’s channeling technique about intermediate wave (1) is clearly breached by upwards movement. This is trend channel confirmation that for now the downwards movement is over and a new upwards trend has begun.
Intermediate wave (2) may not move beyond the start of intermediate wave (1). This main daily wave count is invalidated with movement above 594.59. If price moves above this point then we may use the alternate wave count below.
At 272 primary wave 3 would reach 1.618 the length of primary wave 1. This long term target is months away.
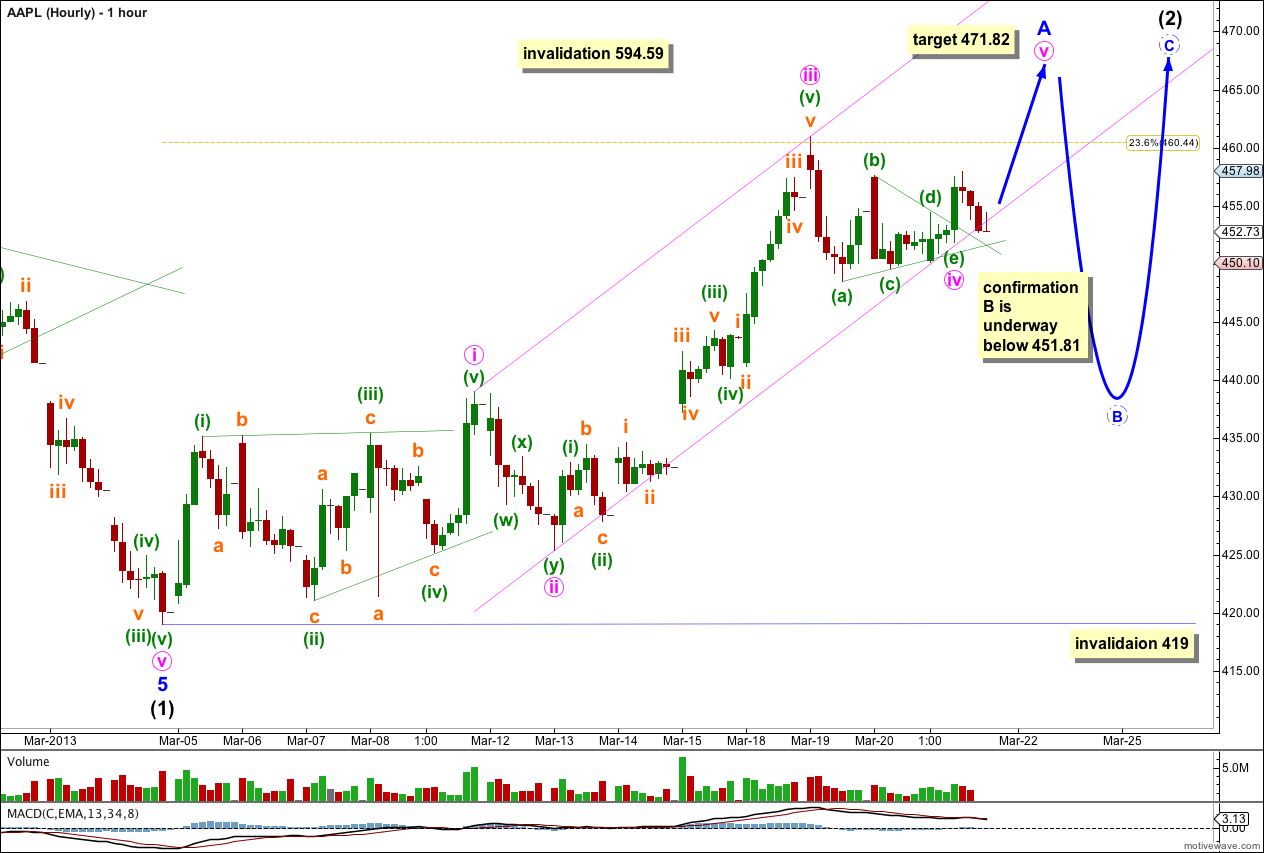
Within intermediate wave (2) minor wave A may be almost complete. Minute wave iii was 3.23 longer than 1.618 the length of minute wave i. Minute wave ii subdivided into a deep double zigzag and minute wave iv subdivided into a shallow triangle providing perfect alternation.
At 471.82 minute wave v would reach equality in length with minute wave i. However, because there is already an adequate Fibonacci ratio between minute waves i and iii, we may not see a Fibonacci ratio between minute wave v and either of i or iii. This target does not have a good probability.
A more reliable method here to see where minute wave v ends at this stage is to use the parallel channel. Draw the channel first with a trend line from the highs of minute waves i to iii, then place a parallel copy upon the low of minute wave ii. Minute wave iv has found support at the lower edge of the channel. Minute wave v may end either mid way within the channel or it may find resistance at the upper edge.
Within minute wave v, when we can see where minuette waves (i) and (iii) have ended, we may use minuette degree to calculate the target for minuette wave (v) to end.
When this channel is breached by subsequent downwards movement then minor wave A would be complete and minor wave B would have begun.
Minor wave B may not move beyond the start of minor wave A. This wave count is invalidated with movement below 419.
Minor wave B should unfold as a three wave structure and should last about two to three weeks, depending upon what structure it takes.
Alternate Daily Wave Count.
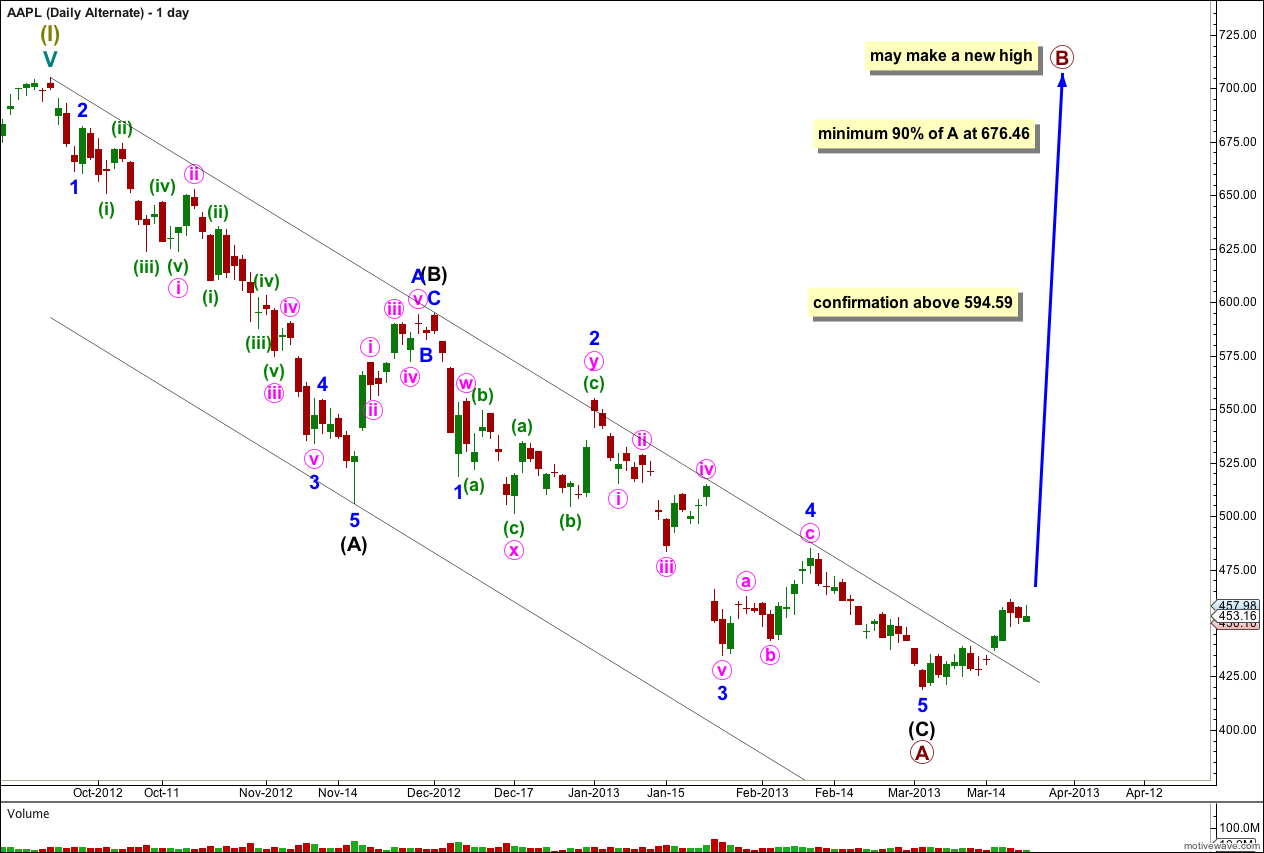
If the main daily wave count is invalidated with upwards movement above 594.59 then this alternate would be confirmed.
If cycle wave a is subdividing into a three wave structure then within it primary wave A may be a complete zigzag. Cycle wave a may be unfolding as a flat correction.
Within primary wave A intermediate waves (A) and (C) have no Fibonacci ratio to each other.
The parallel channel drawn here using Elliott’s technique about a correction is clearly breached by upwards movement. The downwards zigzag is over and an upwards trend has begun.
Primary wave B must subdivide into a three wave structure, most likely a zigzag.
If cycle wave a is a flat correction then primary wave B must reach at least 90% the length of primary wave A at 676.46.
Primary wave B may make a new high above 705.07. Primary wave B should last about six months.