
Last analysis expected upwards movement for the main wave count which is what happened, but price has not yet broken through the confirmation point. Both wave counts remain valid. However, upwards movement for Wednesday’s session does not have the correct subdivisions for the alternate hourly wave count. Because this alternate now does not fit correctly and has the wrong look I will discard it.
The alternate daily wave count is a possibility for us to be aware of, but we should assume the trend remains the same until proven otherwise.
Click on the charts below to enlarge.
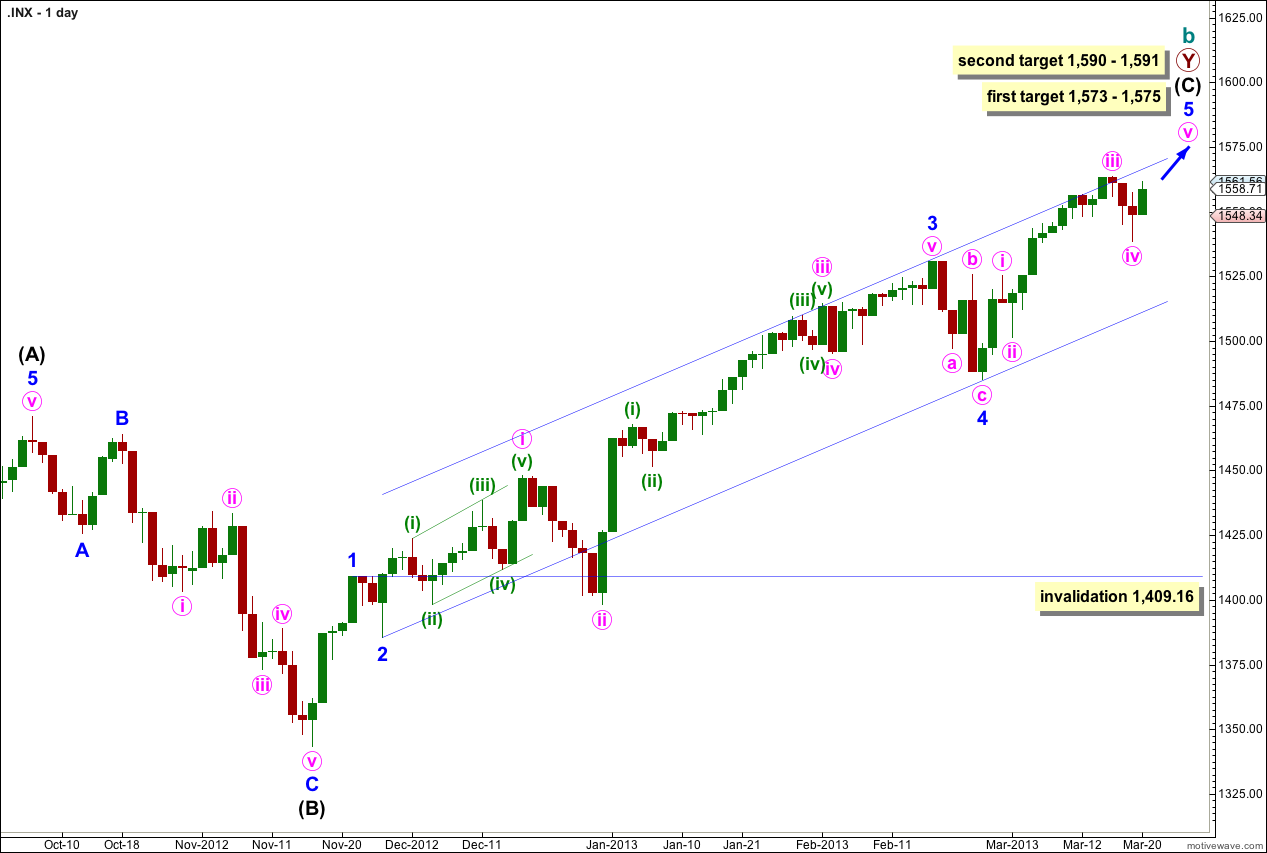
The structure is within the second zigzag of a double labeled primary wave Y. Within this second zigzag intermediate wave (C) may be incomplete.
Within intermediate wave (C) minor waves 1 through to 4 are most likely complete. We may use Elliott’s channeling technique to draw a channel about the impulse of intermediate wave (C). Draw the first trend line from the lows of minor waves 2 to 4, then place a parallel copy upon the high of minor wave 3. At this stage it looks like minor wave 5 may end about the upper edge of this channel.
At 1,573 cycle wave b would reach 105% the length of cycle wave a. This is the minimum requirement for a B wave in relation to an A wave within an expanded flat, and as expanded flats are the most common type of flat this price point has a good probability of being reached.
At 1,575 minor wave 5 would reach 0.618 the length of minor wave 3.
If price continues to move higher through the first target then we may use the second target. At 1,590 intermediate wave (C) would reach 0.618 the length of intermediate wave (A). At 1,591 minor wave 5 would reach 1.618 the length of minor wave 1. This gives us a high probability two point target based upon three wave degrees.
Within intermediate wave (C) minor wave 4 may not move into minor wave 1 price territory. This wave count is invalidated with movement below 1,409.16.
Within intermediate wave (C) minor wave 1 has no Fibonacci duration lasting 4 days, minor wave 2 lasted a Fibonacci 3 days, minor wave 3 lasted a Fibonacci 55 days, and minor wave 4 lasted a Fibonacci 5 days. So far minor wave 5 has lasted 16 days and may be incomplete. A possible end may be at a Fibonacci 21 days which will be in another 5 sessions. If it does not end there then a further 13 sessions would take it to a Fibonacci 34. At each Fibonacci time duration I will look at the structure to see if it could be complete and if so we shall have an alternate wave count for that possibility.
At intermediate degree wave (C) has so far lasted 83 sessions. In another 6 sessions it will have lasted a Fibonacci 89.
The most likely end to this trend may be 27th March, 2013 (give or take one day either side). However, Fibonacci time relationships are not always reliable. This is a guideline only.
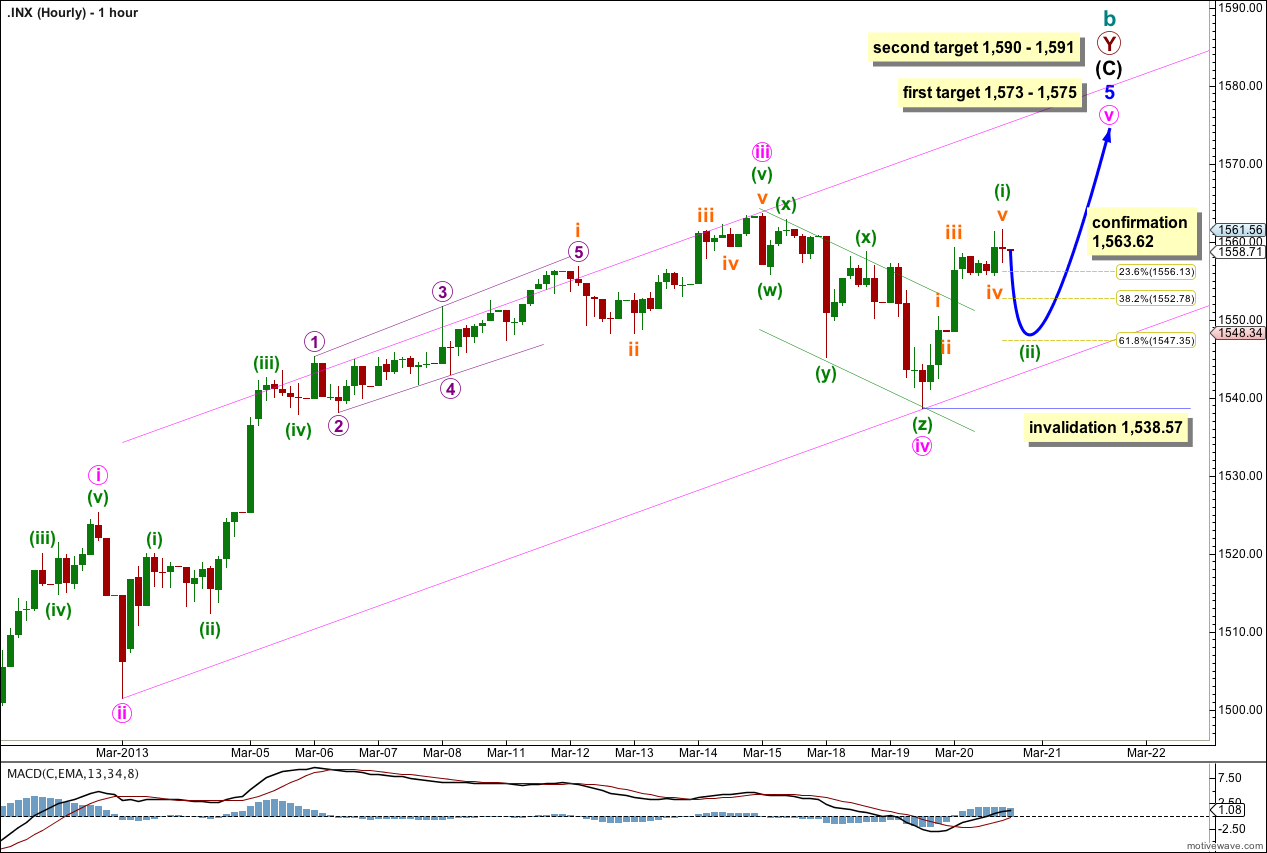
Within minute wave v minuette wave (i) is complete. Minuette wave (ii) should move price lower to start tomorrow’s session. Minuette wave (ii) may end about the 0.618 Fibonacci ratio of minuette wave (i) at 1,547.35, and should find support at the lower end of this parallel channel if it gets down that low.
Thereafter, upwards movement for minuette wave (iii) should take price to a new high. Minuette wave (iii) would be 1.618 the length of minuette wave (i) if it was 37.2 points long.
Movement above 1,563.62 would invalidate the alternate below and confirm this main hourly wave count. At that stage expect further upwards movement to at least 1,573.
Within minor wave 5 minuette wave (ii) may not move beyond the start of minuette wave (i). This wave count is invalidated with movement below 1,538.57.
Although the alternate hourly wave count from yesterday has not been invalidated it is looking so unlikely I will discard it. Upwards movement during Wednesday’s session subdivides into a five, not a three. The alternate would have to see it as a three which does not fit well at all.
Alternate Daily Wave Count.
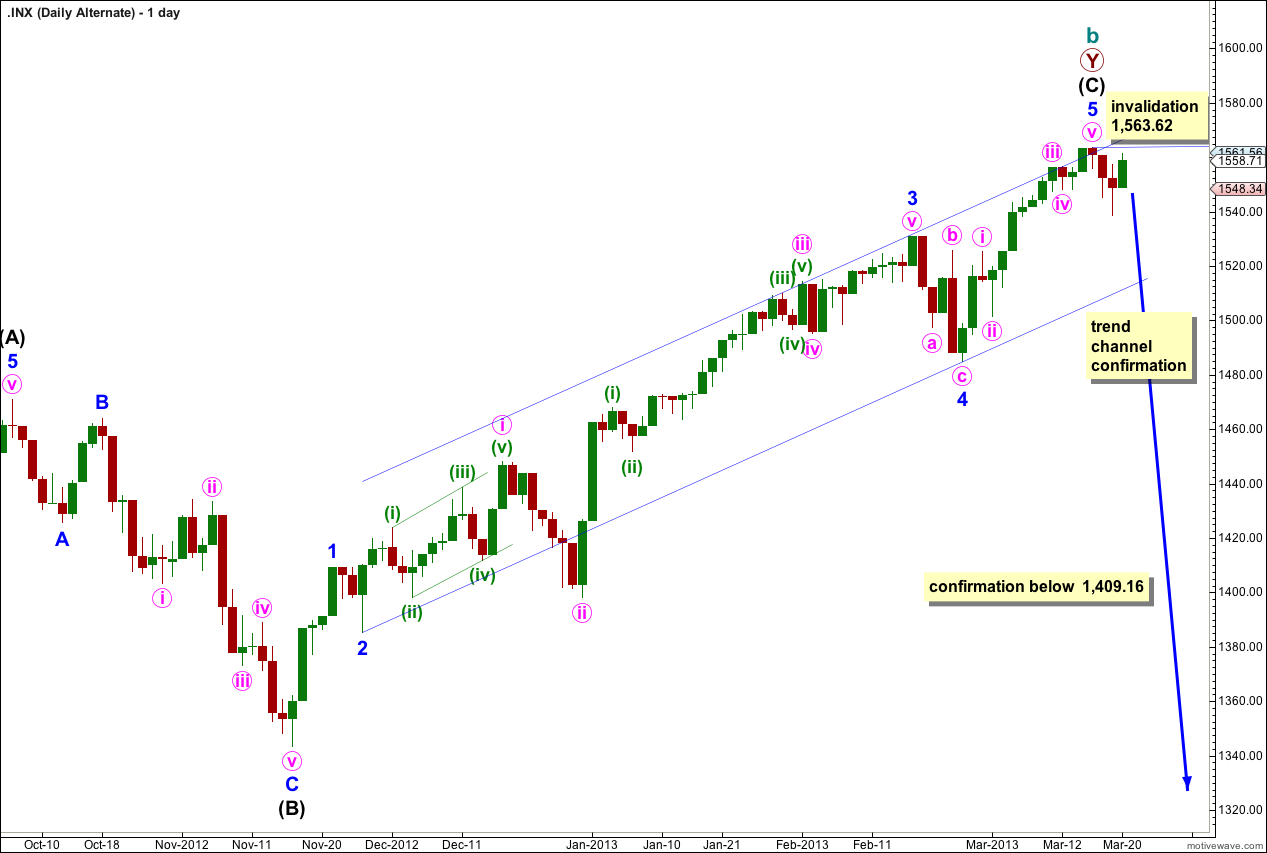
Again we must consider the possibility that we have seen a trend change at cycle degree a few days ago.
We would need to see movement below the blue parallel channel about intermediate wave (C) to have a little confidence in this wave count. At this stage it is just a possibility to be aware of; we have zero confirmation of a trend change.
We should always assume the trend remains the same until proven otherwise. At this stage we should assume the trend remains upwards, until we have confirmation that it has changed.
Any movement above 1,563.62 immediately invalidates this wave count and would give us more confidence in the targets on the main wave count.
Movement below 1,409.16 would provide confidence in a trend change. At that stage downwards movement could not be just a fourth wave correction within the last upwards wave, and so intermediate wave (C) would have to be over.
Looks like a FLAT going into 1495
A chart would be helpful to see what you mean here.
If you mean what I think you mean the B wave within it does not subdivide into a three easily and is over twice the length of the A wave. But I’m just guessing because I have no chart to refer to.