
Yesterday’s analysis expected Tuesday’s session to begin with a fraction of a point or so of upwards movement, then for price to turn and move downwards. This is exactly what happened.
The fourth wave correction is now showing up on the daily chart and this wave count has a typical look. The charts remain the same.
Click on the charts below to enlarge.
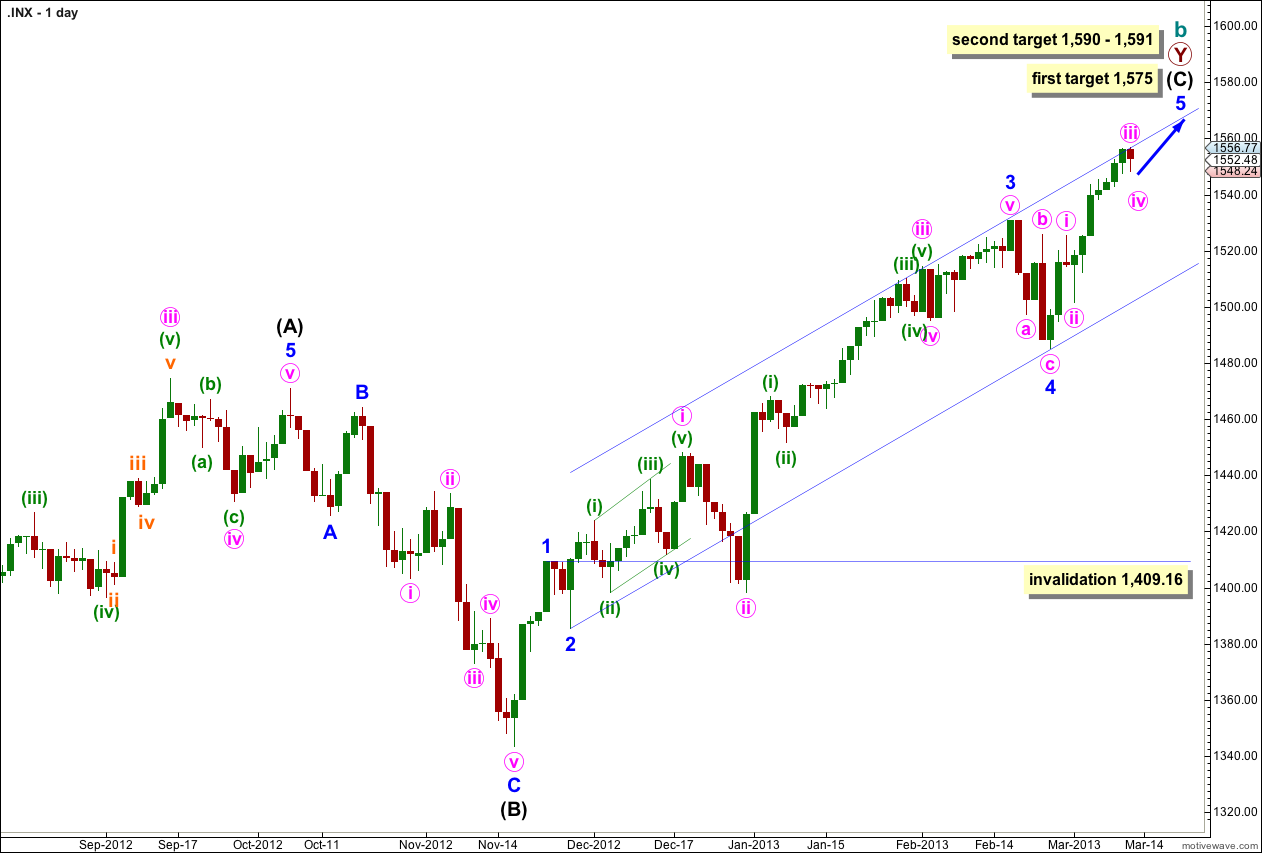
The structure is within the second zigzag of a double labeled primary wave Y. Within this second zigzag intermediate wave (C) is most likely incomplete.
Within intermediate wave (C) minor waves 1 through to 4 are most likely complete. We may use Elliott’s channeling technique to draw a channel about the impulse of intermediate wave (C). Draw the first trend line from the lows of minor waves 2 to 4, then place a parallel copy upon the high of minor wave 3. At this stage it looks like minor wave 5 may end about the upper edge of this channel.
At 1,573 cycle wave b would reach 105% the length of cycle wave a. This is the minimum requirement for a B wave in relation to an A wave within an expanded flat, and as expanded flats are the most common type of flat this price point has a good probability of being reached.
At 1,575 minor wave 5 would reach 0.618 the length of minor wave 3.
If price continues to move higher through the first target then we should expect the next likely target to be at 1,590 where intermediate wave (C) would reach 0.618 the length of intermediate wave (A), and at 1,591 minor wave 5 would reach 1.618 the length of minor wave 1.
Within intermediate wave (C) minor wave 4 may not move into minor wave 1 price territory. This wave count is invalidated with movement below 1,409.16.
Within intermediate wave (C) minor wave 1 has no Fibonacci duration lasting 4 days, minor wave 2 lasted a Fibonacci 3 days, minor wave 3 lasted a Fibonacci 55 days, and minor wave 4 lasted a Fibonacci 5 days. So far minor wave 5 has lasted 10 days and is incomplete. A possible end may be at a Fibonacci 21 days which will be in another 11 sessions. If it does not end there then a further 13 sessions would take it to a Fibonacci 34. At each Fibonacci time duration I will look at the structure to see if it could be complete and if so we shall have an alternate wave count for that possibility.
At intermediate degree wave (C) has so far lasted 77 sessions. In another 12 sessions it will have lasted a Fibonacci 89.
The most likely end to this trend may be 28th March, 2013 (give or take one day either side). However, Fibonacci time relationships are not always reliable. This is a guideline only.
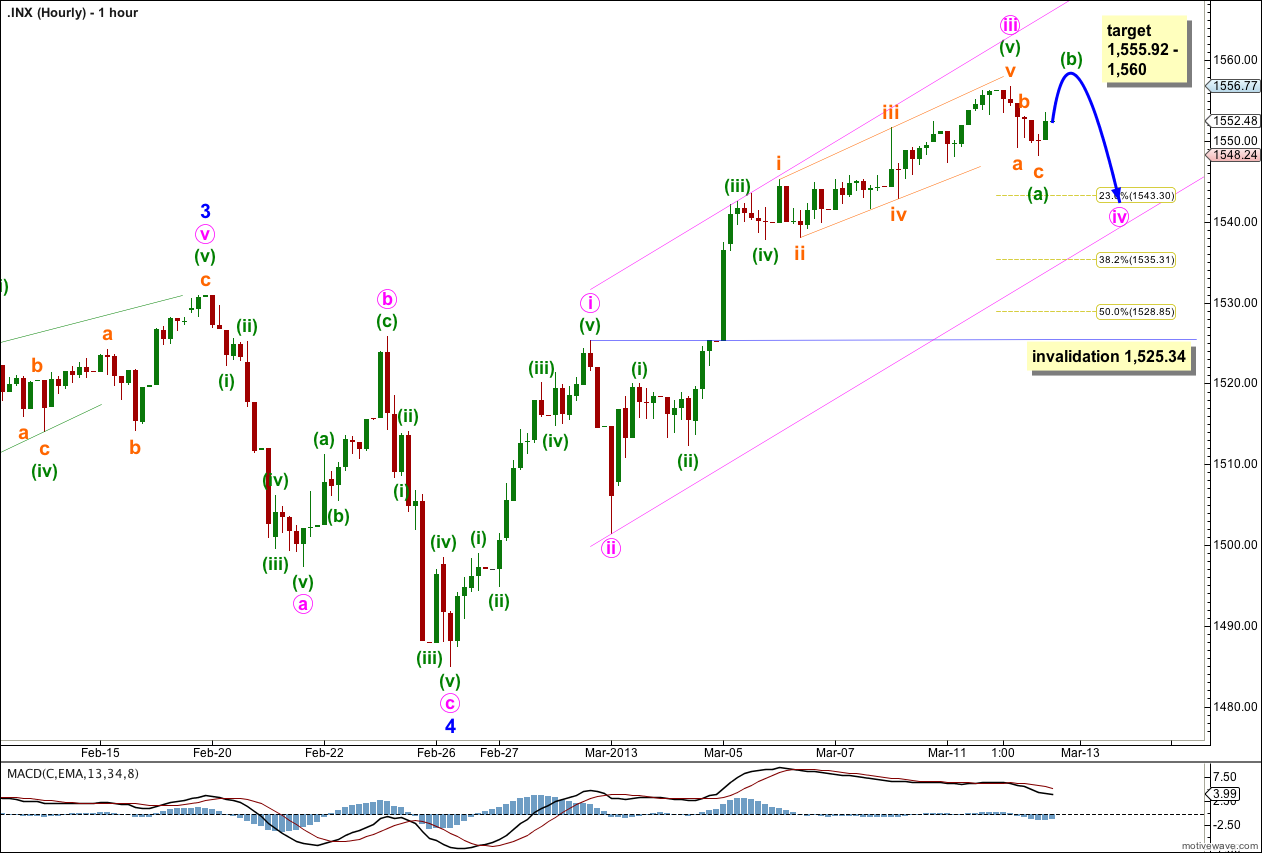
With the session beginning with a very slight new high, 0.55 points above Monday’s high, the structure for minuette wave (v) ending expanding diagonal now has perfect wave lengths. Subminuette wave v is now slightly longer than subminuette wave iii.
On the five minute chart downwards movement for Tuesday’s session subdivides nicely into a zigzag which may be minuette wave (a).
If minute wave iv is unfolding as a flat correction then minuette wave (b) should be a minimum of 90% the length of minuette wave (a) at 1,555.92. The maximum common length of minuette wave (b) for a flat is 138% the length of minuette wave (a) at 1,560. Minuette wave (b) may make a new high.
If minute wave iv is unfolding as a double combination then the downwards zigzag may be labeled minuette wave (w) and upwards movement would be an incomplete three for minuette wave (x). The subdivisions so far would be expected to be the same, so we cannot tell at this stage if this is a single flat or a double. But the length of minuette wave (x) does not have to be 90% of minuette wave (w). If price fails to reach up to 1,555.92 then I would expect that a double zigzag or double combination may be unfolding.
If minute wave iv is unfolding as a triangle then upwards movement does not have to reach 1,555.92 either. A triangle is the least likely structure we shall see.
I have redrawn the parallel channel now that minute wave iii is over. Draw the first trend line from the highs of minute waves i to iii, push it out to sit on the high of minuette wave (iii) within minute wave iii. Place a parallel copy upon the low of minute wave ii. Minute wave iv may find support at the lower end of this channel, which looks now to be about the 0.236 Fibonacci ratio of minute wave iii at 1,543.30.
When minuette wave (b) is a complete three wave structure then I can calculate a target for minuette wave (c) downwards to end minute wave iv. I may be able to do this after one more session.
With this correction now showing on the daily chart I have more confidence that the wave count is correct. This correction should show up on the daily chart because minute wave ii shows up as well. Minute wave iv, if it is to have a Fibonacci time relationship, may last a Fibonacci 3 or 5 sessions. This would see it end on either the 15th or 19th of March.
Minute wave iv may not move into minute wave ii price territory. This wave count is invalidated with movement below 1,525.34.
Dow Jones Weekly RSI(14)= 73.25 http://scharts.co/16sWlhm over 70 can not last very long
That fits nicely with the wave count. Almost there…