
Yesterday’s analysis expected upwards movement from the S&P 500 for Tuesday’s session, which was likely to make a new high. This is exactly what has happened. Additionally, MACD shows an increase in upwards momentum on the hourly chart, which is exactly what we should expect to see for a third wave.
The alternate daily wave count has been invalidated. We now have just the one daily wave count with two hourly wave counts.
Click on the charts below to enlarge.
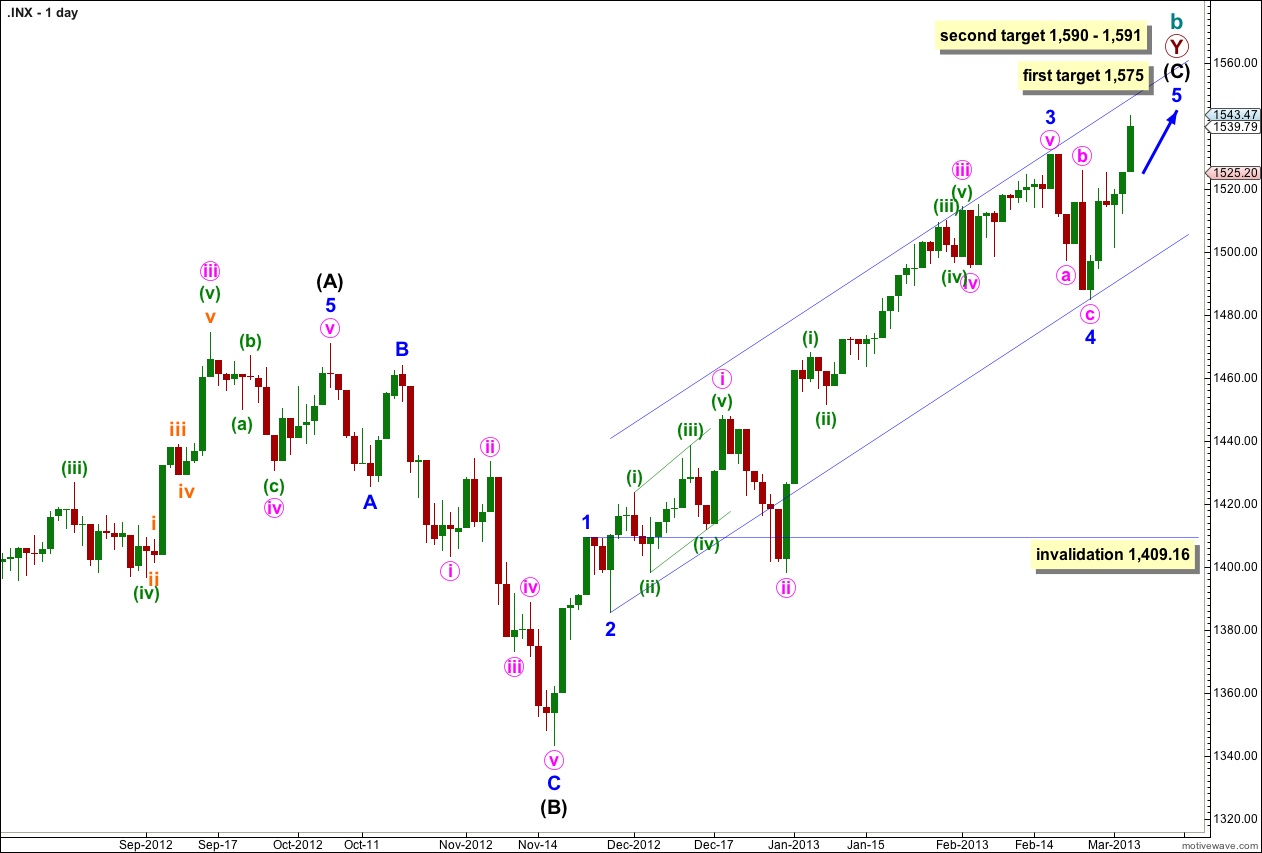
The structure is within the second zigzag of a double labeled primary wave Y. Within this second zigzag intermediate wave (C) is most likely incomplete.
Within intermediate wave (C) minor waves 1 through to 4 are most likely complete. We may use Elliott’s channeling technique to draw a channel about the impulse of intermediate wave (C). Draw the first trend line from the lows of minor waves 2 to 4, then place a parallel copy upon the high of minor wave 3. At this stage it looks like minor wave 5 may end about the upper edge of this channel.
At 1,575 minor wave 5 would reach 0.618 the length of minor wave 3.
If price continues to move higher through the first target then we should expect the next likely target to be at 1,590 where intermediate wave (C) would reach 0.618 the length of intermediate wave (A), and at 1,591 minor wave 5 would reach 1.618 the length of minor wave 1.
Within intermediate wave (C) minor wave 4 may not move into minor wave 1 price territory. This wave count is invalidated with movement below 1,409.16.
Within intermediate wave (C) minor wave 1 has no Fibonacci duration lasting 4 days, minor wave 2 lasted a Fibonacci 3 days, minor wave 3 lasted a Fibonacci 55 days, and minor wave 4 was likely to be over in a Fibonacci 5 days. So far minor wave 5 has lasted 5 days and is incomplete. A possible end may be at a Fibonacci 13 days which will be in another 8 days. If it does not end there then a further 8 days would take it to a Fibonacci 21. At each Fibonacci time duration I will look at the structure to see if it could be complete and if so we shall have an alternate wave count for that possibility.
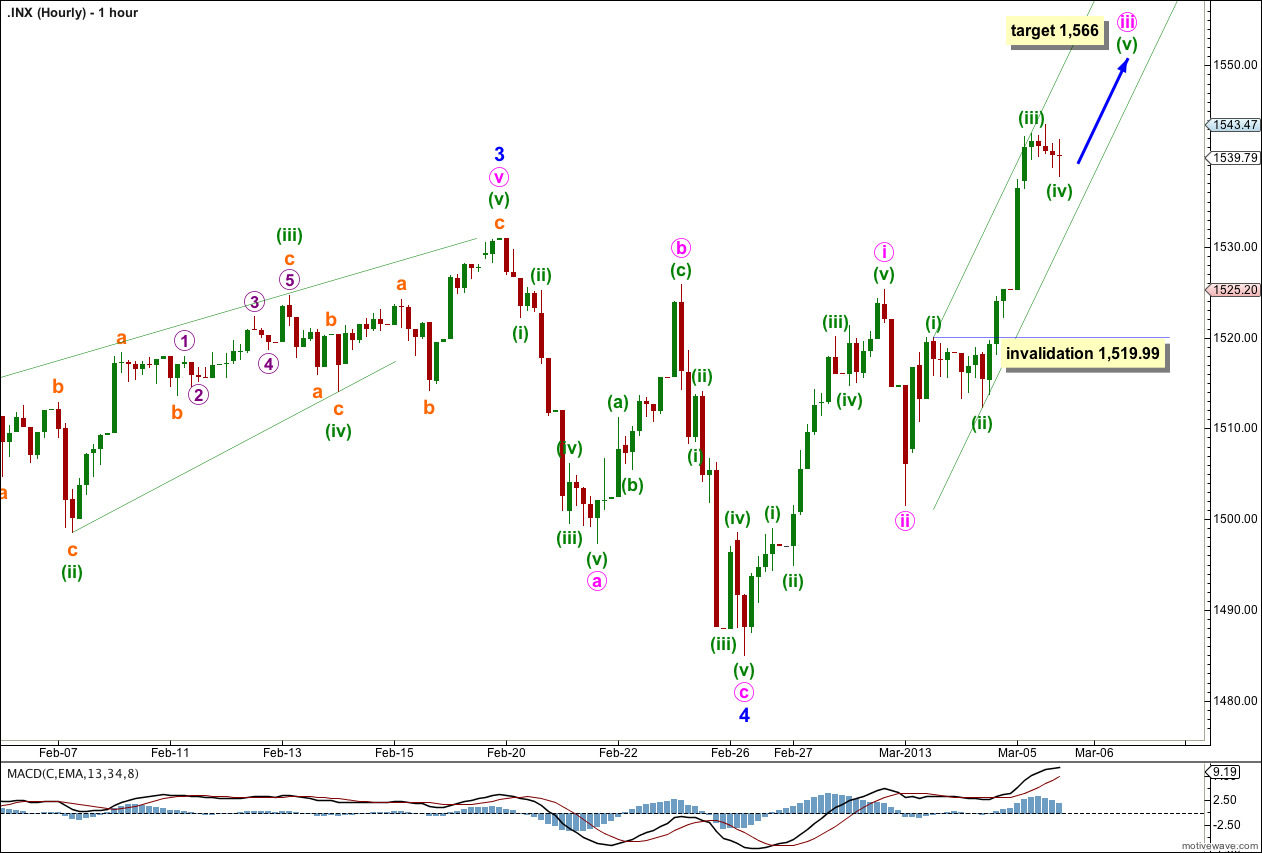
It is most likely that minor wave 4 is over and minor wave 5 has begun.
Momentum has increased as a third wave upwards unfolds.
Within minute wave iii minuette wave (iii) is just 0.29 points longer than 1.618 the length of minuette wave (i). We may not see a Fibonacci ratio between minuette wave (v) and either of (i) or (iii).
At 1,566 minute wave iii would reach 1.618 the length of minute wave i. This target may be two or three sessions away now.
We may now use Elliott’s channeling technique to draw a channel about this third wave. Draw the first trend line from the highs of minuette waves (i) to (iii), then place a parallel copy upon the low of minuette wave (ii). If minuette wave (iv) moves further sideways or lower it may be contained within this channel. If it breaches the channel we must redraw it.
Minuette wave (v) may end either mid way within the channel or about the upper edge.
On the 5 minute chart minuette wave (iv) subdivides into a completed double zigzag. It is likely that it is over here. If it does move further sideways or lower it may not move into minuette wave (i) price territory. This wave count is invalidated at minuette degree with movement below 1,519.99.
When minor wave 5 can be seen as a completed five wave impulse we shall have to consider an alternate with the degree of labeling within minor wave 5 all moved down one degree. At that stage we will need to use confirmation / invalidation points to determine if the trend is over.
Alternate Hourly Wave Count.
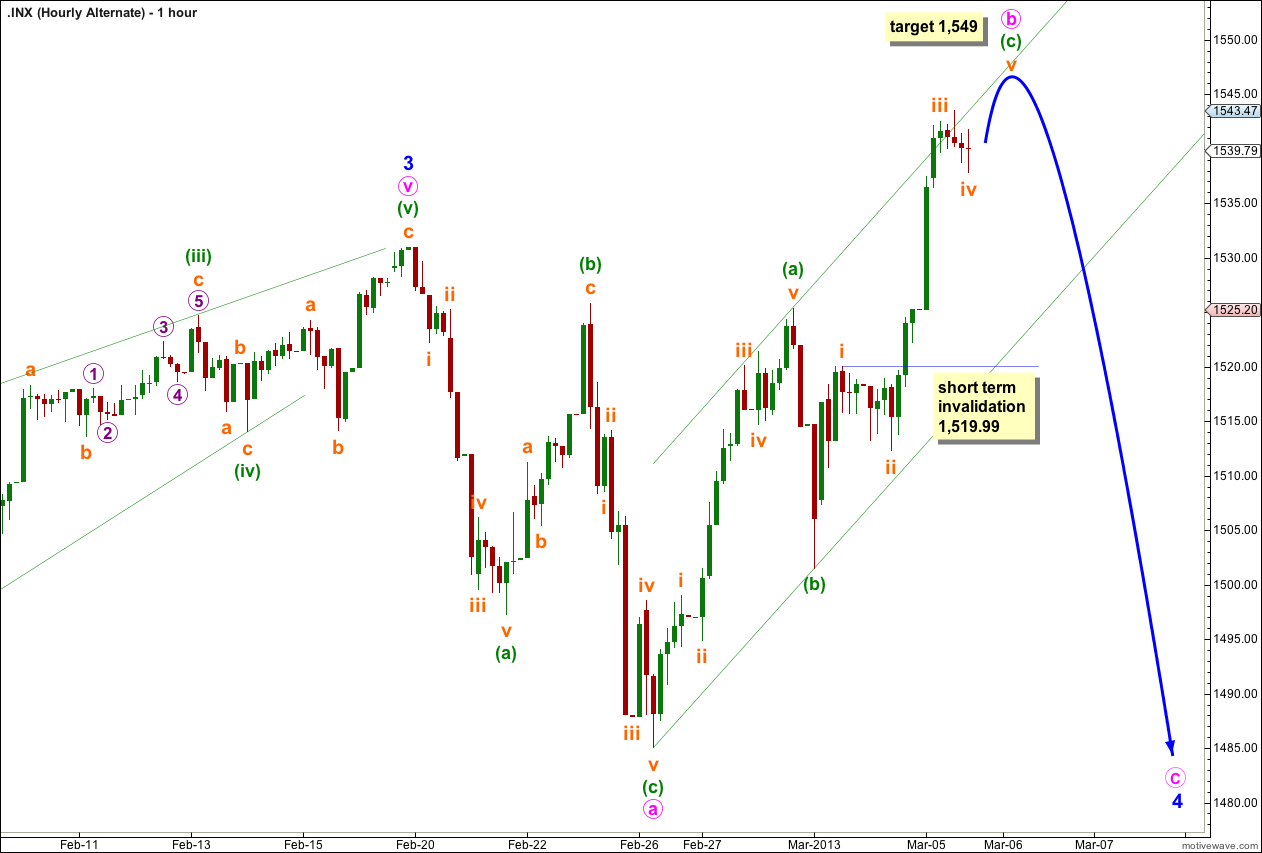
It remains possible that minor wave 4 is an incomplete expanded flat correction. Within it minute wave b has now passed the minimum requirement of 90% the length of minute wave a.
At 1,577 minute wave b would be twice the length of minute wave a. The expanded flat structure for minor wave 4 is not technically invalidated at that point, but it becomes so unlikely that this wave count would be discarded. Prior to that point this is a possibility we should consider.
At 1,549 subminuette wave v within minuette wave (c) would reach 0.618 the length of subminuette wave i.
When this five upwards here labeled minuette wave (c) and minute wave iii on the main hourly chart is complete then this alternate will diverge with the main wave count. At that stage the main wave count would expect price to not move below 1,525.34 and this alternate would require it.
In the short term both hourly wave counts expect upwards movement and have the same invalidation point.
Subminuette wave iv may not move into subminuette wave i price territory. This wave count is invalidated in the short term with movement below 1,519.99.
Looks like wave (iv) is not done 1531 needs to hold
Not necessarily. The upwards movement subdivides nicely on the five minute chart as a five (although it is ambiguous and could be seen as a three). This may have been a shorter than expected minuette wave (v). When the channel is breached we can consider it confirmed.