
Last analysis expected some upwards movement most likely for Friday’s session which is what we have seen.
I am changing the monthly wave count. It does not change expected direction but it does change targets.
I have two daily wave counts with the main wave count having a higher probability.
Click on the charts below to enlarge.
New Main Monthly Wave Count.
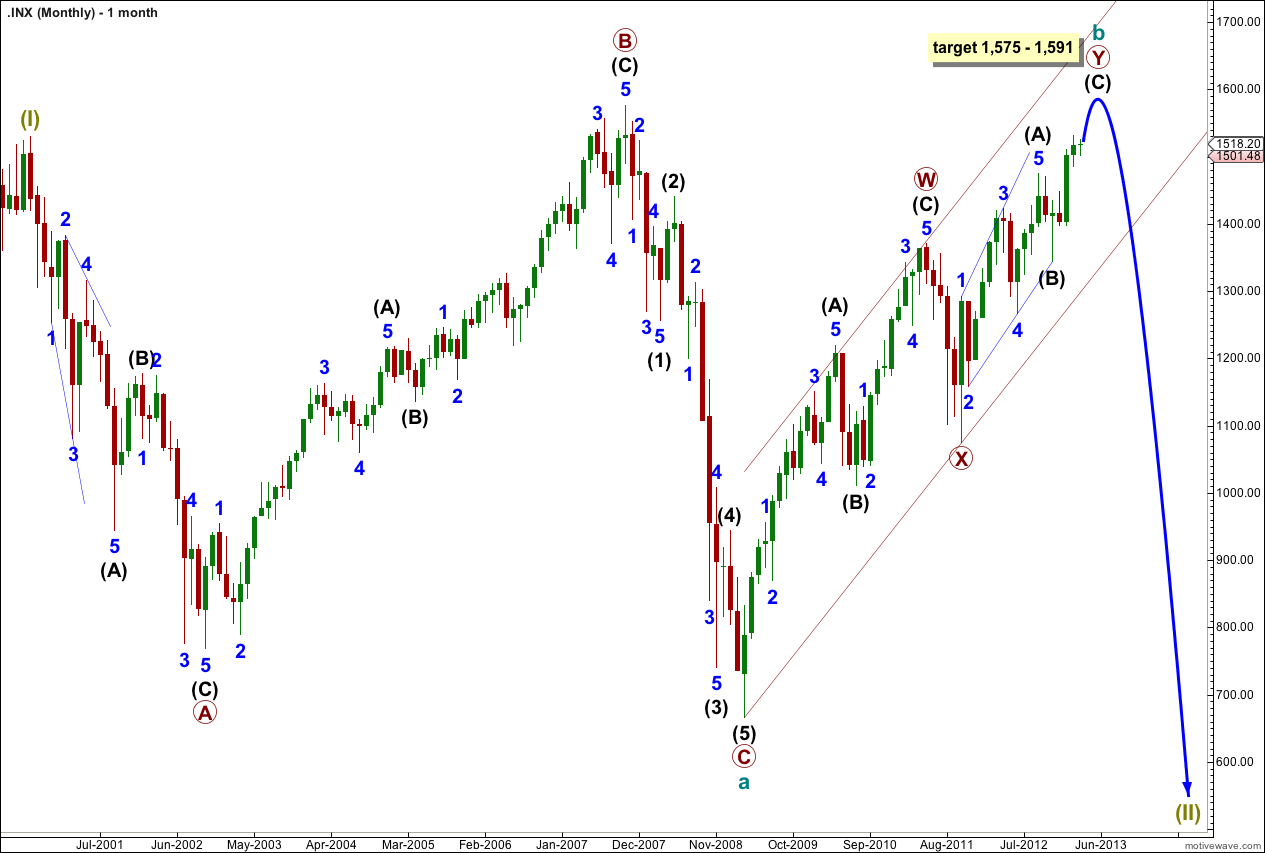
The last monthly wave count looked at a double flat unfolding for super cycle wave (II). I have changed the wave count to see a single flat unfolding. I have also moved all labeling down one degree.
This means upwards movement from the low of 666.79 is not an X wave but a B wave, which may subdivide into a multiple.
Within the flat cycle wave a is complete as a three wave structure, an expanded flat correction.
Cycle wave b is an incomplete double zigzag. It passed the minimum required length for a B wave of a flat at 90% of the A wave at 1,444.
If this structure at super cycle degree is an expanded flat then cycle wave b should reach 105% the length of cycle wave a at 1,573.
At 1,573 minor wave 5 (seen on the daily chart below) would reach 0.618 the length of minor wave 3.
At 1,590 intermediate wave (C) would reach 0.618 the length of intermediate wave (A).
At 1,591 minor wave 5 (seen on the daily chart below) would reach 1.618 the length of minor wave 1.
The first target will be about 1,573. If price continues higher through that target then the next likely target will be about 1,590.
When the channel drawn about this double zigzag is breached on the monthly chart we shall have confirmation at cycle degree of a trend change. Cycle wave c is likely to be about 1,397 points in length and should last one to several years.
Movement below 1,343.75 (the end of intermediate wave (B) within primary wave Y) would be an early price indication of a trend change.
The trend change may yet be a few weeks away.
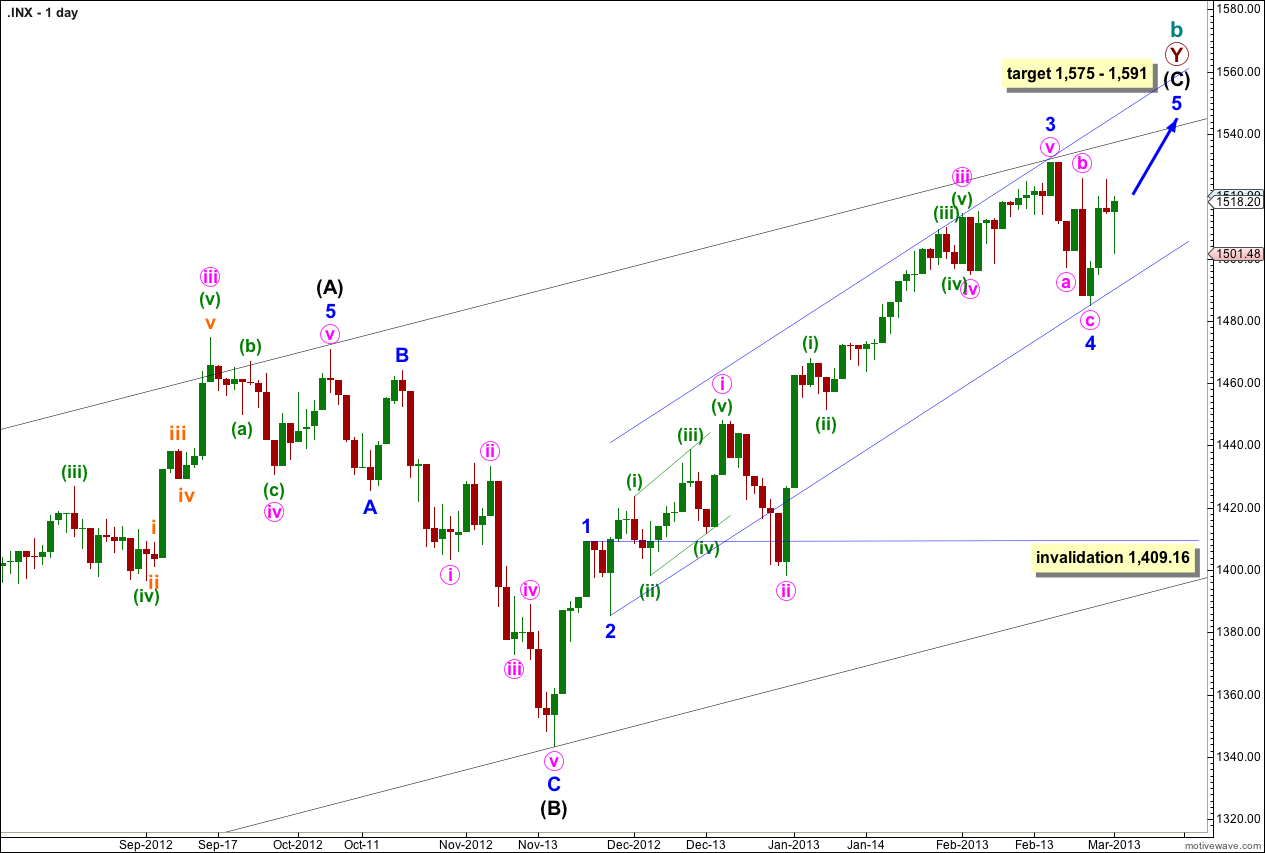
The structure is within the second zigzag of a double labeled primary wave Y. Within this second zigzag intermediate wave (C) is most likely incomplete.
Within intermediate wave (C) minor waves 1 through to 4 are most likely complete. We may use Elliott’s channeling technique to draw a channel about the impulse of intermediate wave (C). Draw the first trend line from the lows of minor waves 2 to 4, then place a parallel copy upon the high of minor wave 3. We may see minor wave 5 end mid way within the channel, or possibly about the upper edge.
I will continue also to draw the channel about the upper edge of primary wave Y: from the end of minor wave 4 within intermediate wave (A) to the low labeled intermediate wave (B), with a parallel copy upon the high of intermediate wave (A). This channel may continue to provide some resistance to upwards movement.
Within intermediate wave (C) minor wave 4 may not move into minor wave 1 price territory. This wave count is invalidated with movement below 1,409.16.
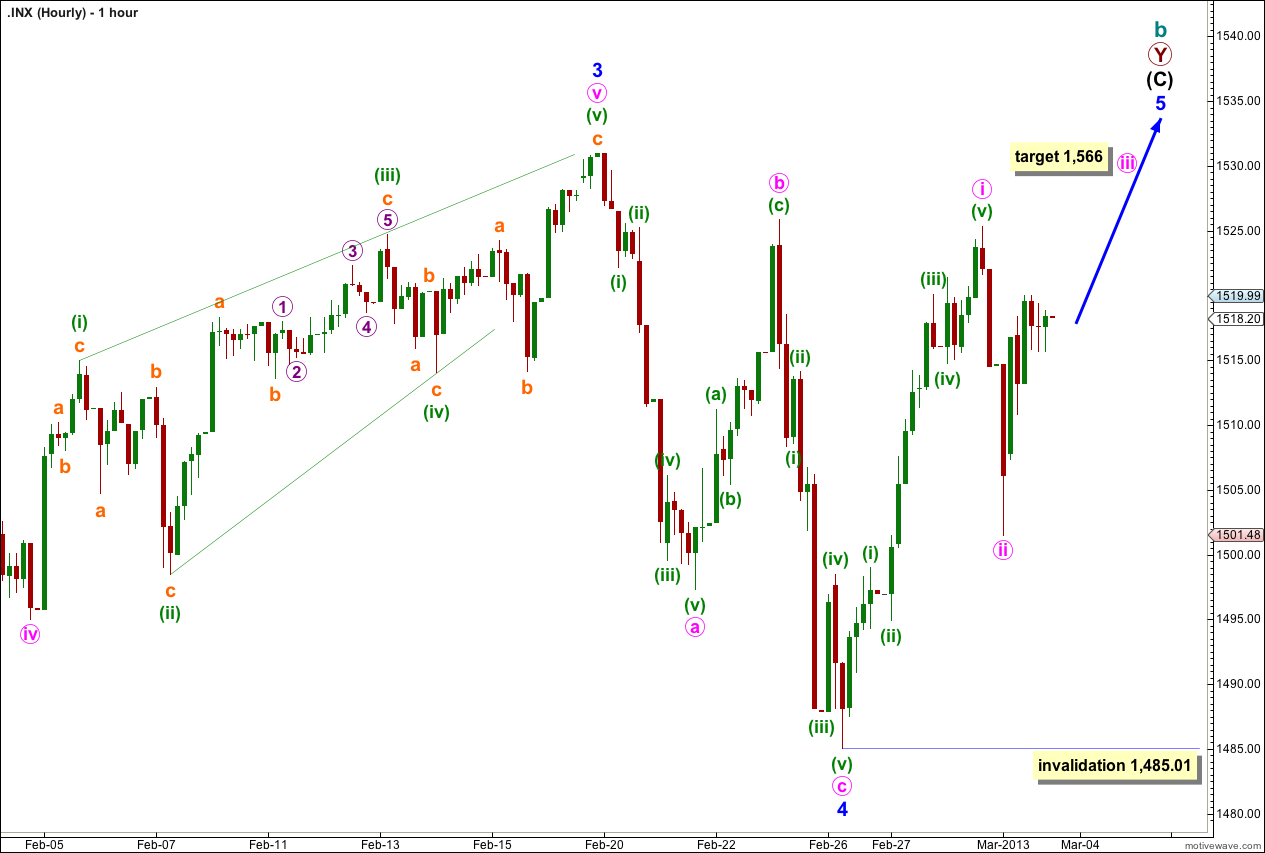
This first hourly wave count sees minor wave 4 as a complete zigzag lasting one week. At minor degree this has a good duration and fit with the length of minor waves 1, 2 and 3. It has the right look if it was over already.
Within minor wave 5 minute wave i is complete. Minute wave ii may or may not be complete. If it moves lower it may not move beyond the start of minute wave i. This wave count is invalidated at minute wave degree with movement below 1,485.01.
If minute wave ii is complete then at 1,566 minute wave iii would reach 1.618 the length of minute wave i. This target is a few sessions away, maybe a couple of weeks.
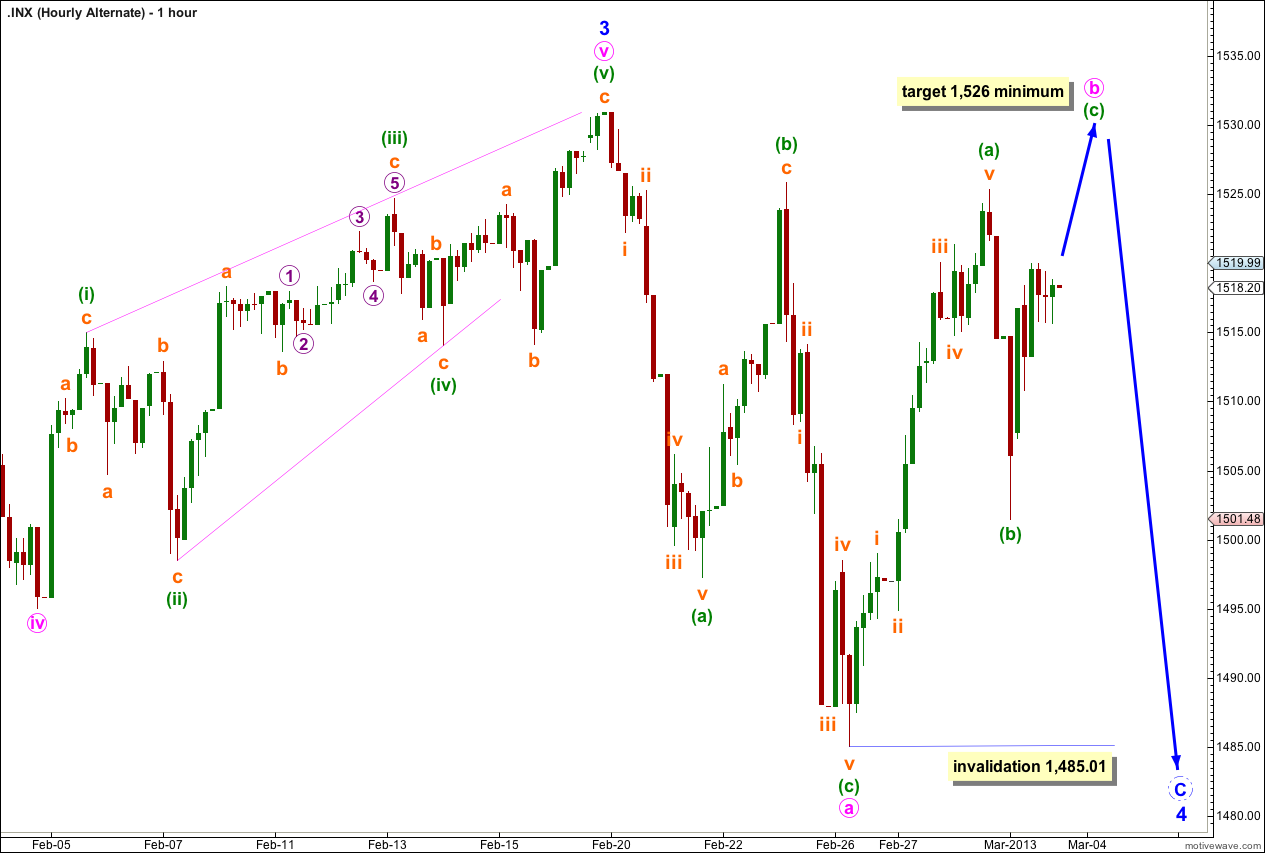
It is possible that minor wave 4 is not over and may be continuing further as a flat (or maybe also a double combination).
If minor wave 4 is unfolding as a flat (most likely) then within it minute wave b must reach at least 90% the length of minute wave a at 1,526.
Minute wave b may make a new high above the start of minute wave a at 1,530.94.
Thereafter, minute wave c is extremely likely to move to a new low below the end of minute wave a at 1,485.01 to avoid a truncation and a rare running flat.
Within minute wave b if minuette wave (b) is not over and moves lower it may not move beyond the start of minuette wave (a). This alternate hourly wave count is also expecting upwards movement and is invalidated in the short term if price moves below 1,485.01.
Alternate Daily Wave Count.
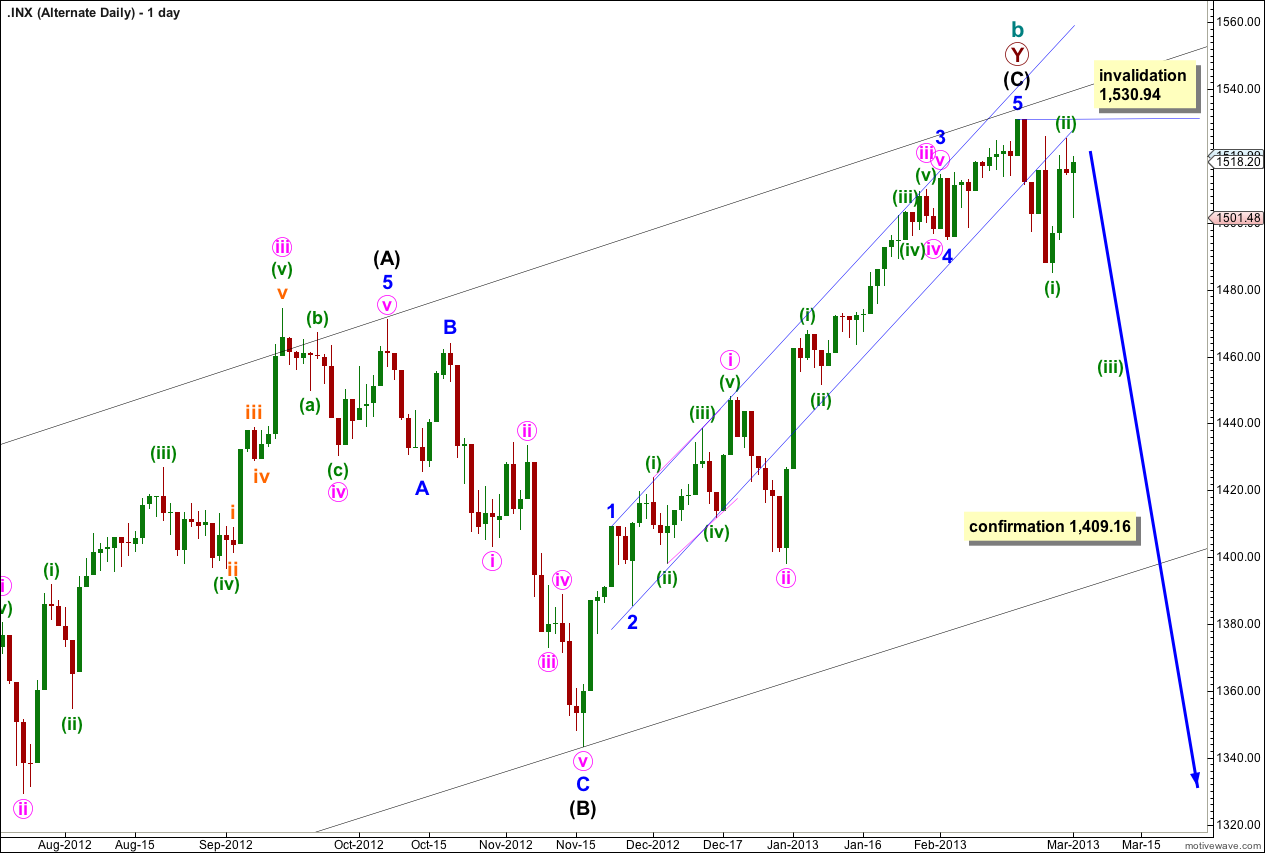
It is also possible that we have seen a trend change for this new monthly wave count at cycle degree. Cycle wave b would be 864.15 points in length and cycle wave a was 863.22 points in length. At super cycle degree the structure would be a regular flat and cycle wave c would be expected to end just a little below the end of cycle wave a at 666.79.
If we have had a trend change then a leading diagonal may be unfolding in a first wave position. Within the leading diagonal minuette wave (ii) may not move beyond the start of minuette wave (i). This alternate is invalidated with movement above 1,530.94.
We would not have confirmation of a trend change until price moves below 1,409.16 in the first instance.
Yes, sweet I feel your new monthly charts is spot on.