
Yesterday’s main wave count had two hourly charts which both expected some more upwards movement for Thursday’s session which is what we have got. Price has not met the minimum level required for the main hourly wave count.
All the wave counts are the same. At this stage they again do not diverge. They all expect exactly the same movement tomorrow.
Click on the charts below to enlarge.
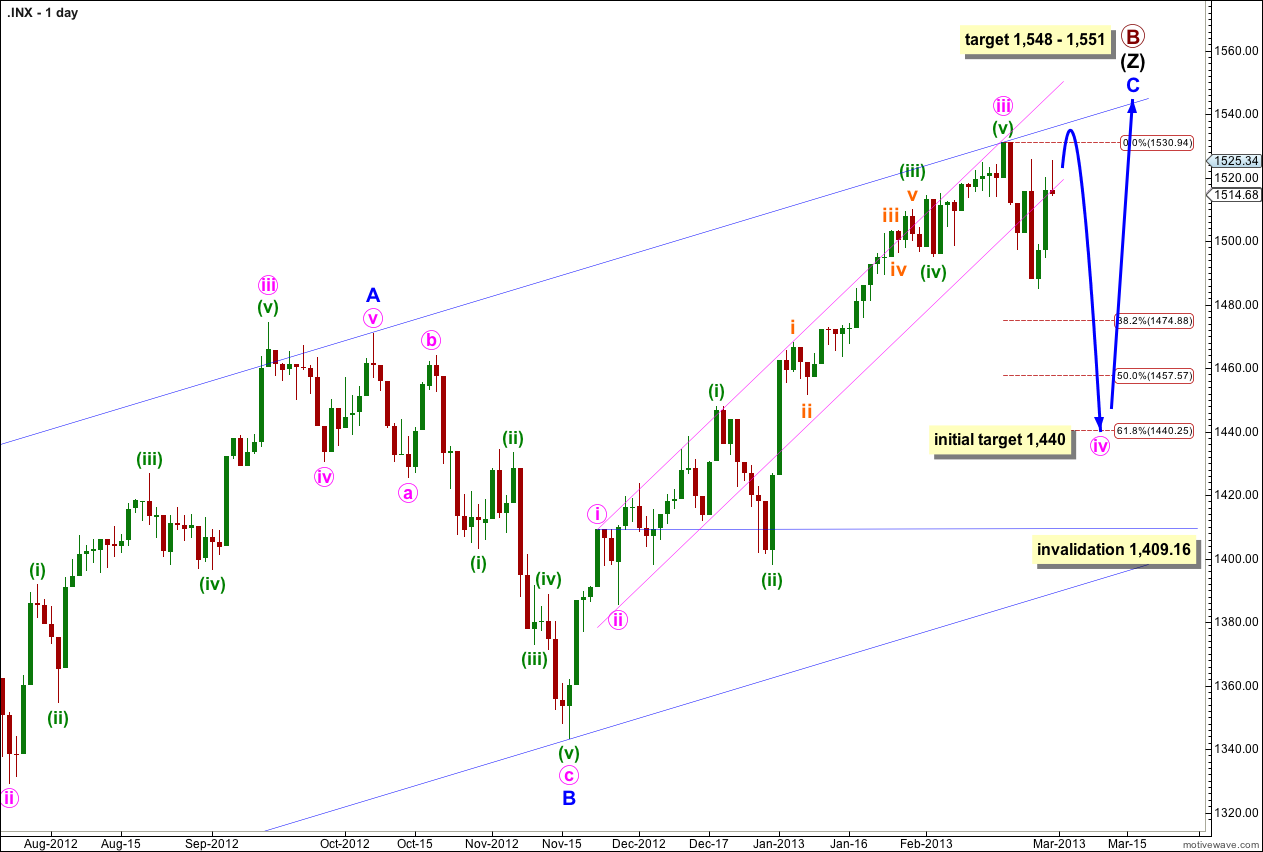
Minute wave iv should exhibit choppy overlapping downwards movement. It may be over already (an alternate wave count on the hourly chart below) or it may continue further.
Because minute wave ii was a shallow 36% correction of minute wave i then minute wave iv may end about 1,440 at 0.618 the length of minute wave iii, given the guideline of alternation.
Minute wave ii was a zigzag so we may expect minute wave iv to be a flat, double or triangle. A flat is most likely.
The most common type of flat is an expanded flat which has a B wave that makes a new price extreme beyond the end of the A wave. A new high above 1,530.94 is possible if wave iv pink unfolds as a flat.
If minute wave iii is over it lasted a Fibonacci 55 days. Within it minuette wave (i) lasted 14 days, one more than a Fibonacci 13, minuette wave (ii) lasted a Fibonacci 8 days, minuette wave (iii) lasted 20 days, one less than a Fibonacci 21, minuette wave (iv) lasted a Fibonacci 3 days, and minuette wave (v) may have had no Fibonacci duration. So far minute wave iv has lasted seven days.
Minute wave (v) may move price to a new high (although it does not have to) and may end again on the upper edge of the wider parallel channel containing the zigzag of intermediate wave (Z).
At 1,548 minor wave C would reach equality in length with minor wave A.
Minute wave iv may not move into minute wave i price territory. This wave count is invalidated with movement below 1,409.16.
If this main wave count is invalidated then the alternate wave count will be strongly confirmed.
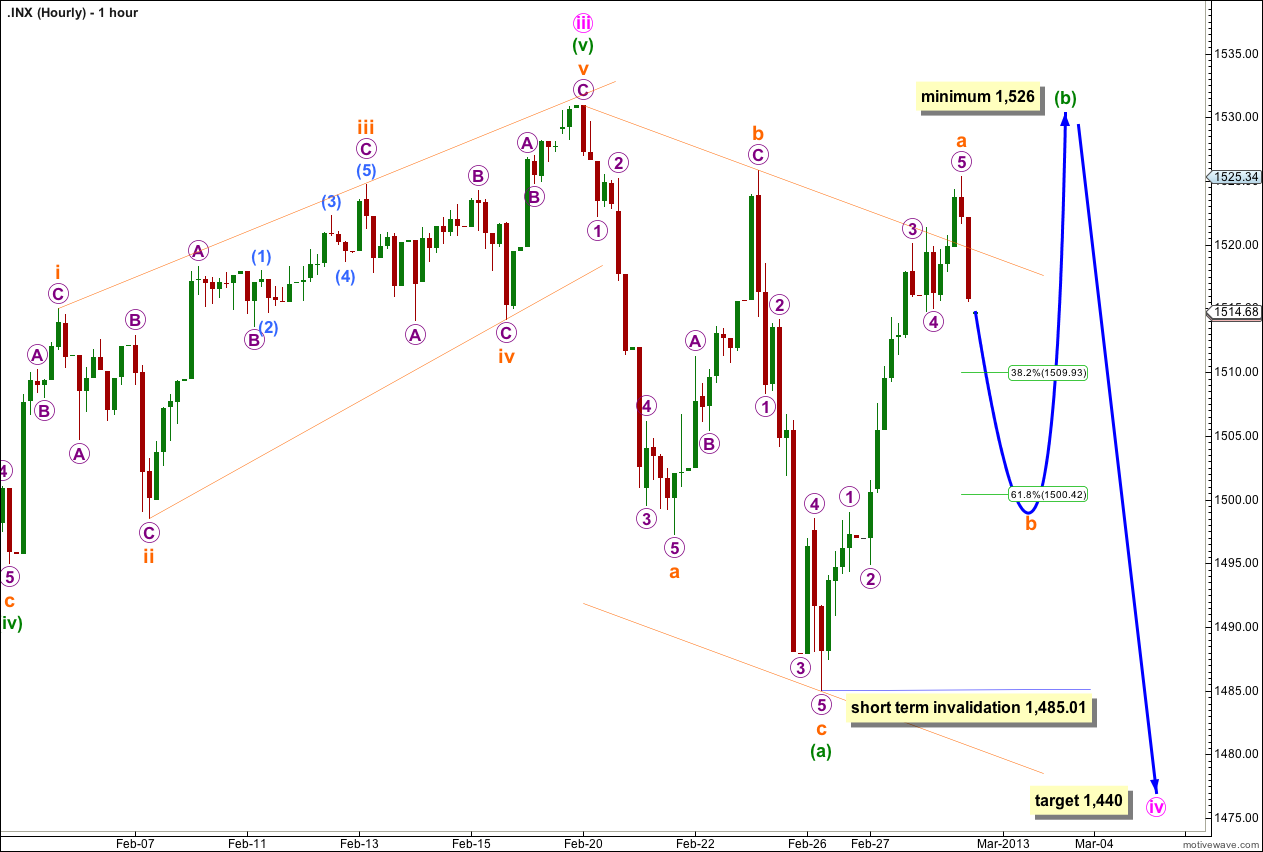
This main wave count expects minute wave iv to exhibit alternation in depth and structure to minute wave ii. Minute wave iv would be most likely to be a deep expanded flat correction.
Within the expanded flat minuette wave (a) is a complete zigzag. Minuette wave (b) upwards is also completing as a zigzag and it must reach at least 90% the length of minuette wave (a) at 1,526. Minuette wave (b) may make a new price high.
Within minuette wave (b) ratios within subminuette wave a are: micro wave 3 has no Fibonacci ratio to micro wave 1, and micro wave 5 is 0.68 points longer than 0.382 the length of micro wave 3.
Subminuette wave b must subdivide as a three wave structure. It may end about the 0.382 or 0.618 Fibonacci ratios of subminuette wave a.
Thereafter, subminuette wave c would complete a zigzag for minuette wave (b).
Subminuette wave b may not move beyond the start of subminuette wave a. This wave count is invalidated in the short term with movement below 1,485.01.
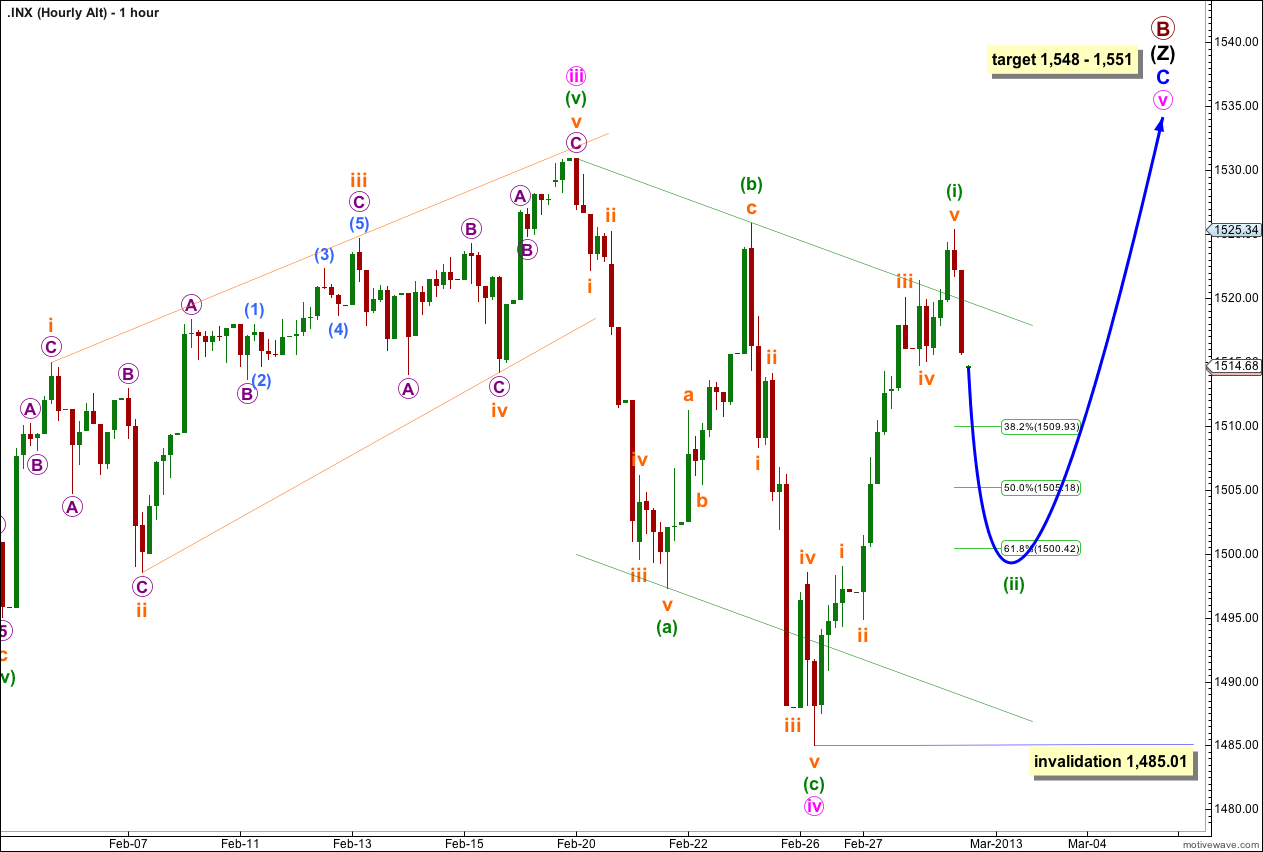
It is still possible that minute wave iv is a complete zigzag showing little alternation with minute wave ii.
Minute wave v will reach equality with minute wave i at 1,551. Minor wave C would reach equality with minor wave A at 1,548. This gives us a three point target zone for upwards movement to end at primary wave degree.
Within minute wave v I have moved the labeling down one degree today. Minuette wave (i) only is likely to be over.
Minuette wave (ii) may not move beyond the start of minuette wave (i). This wave count also is invalidated in the short term with movement below 1,485.01.
Alternate Wave Count.
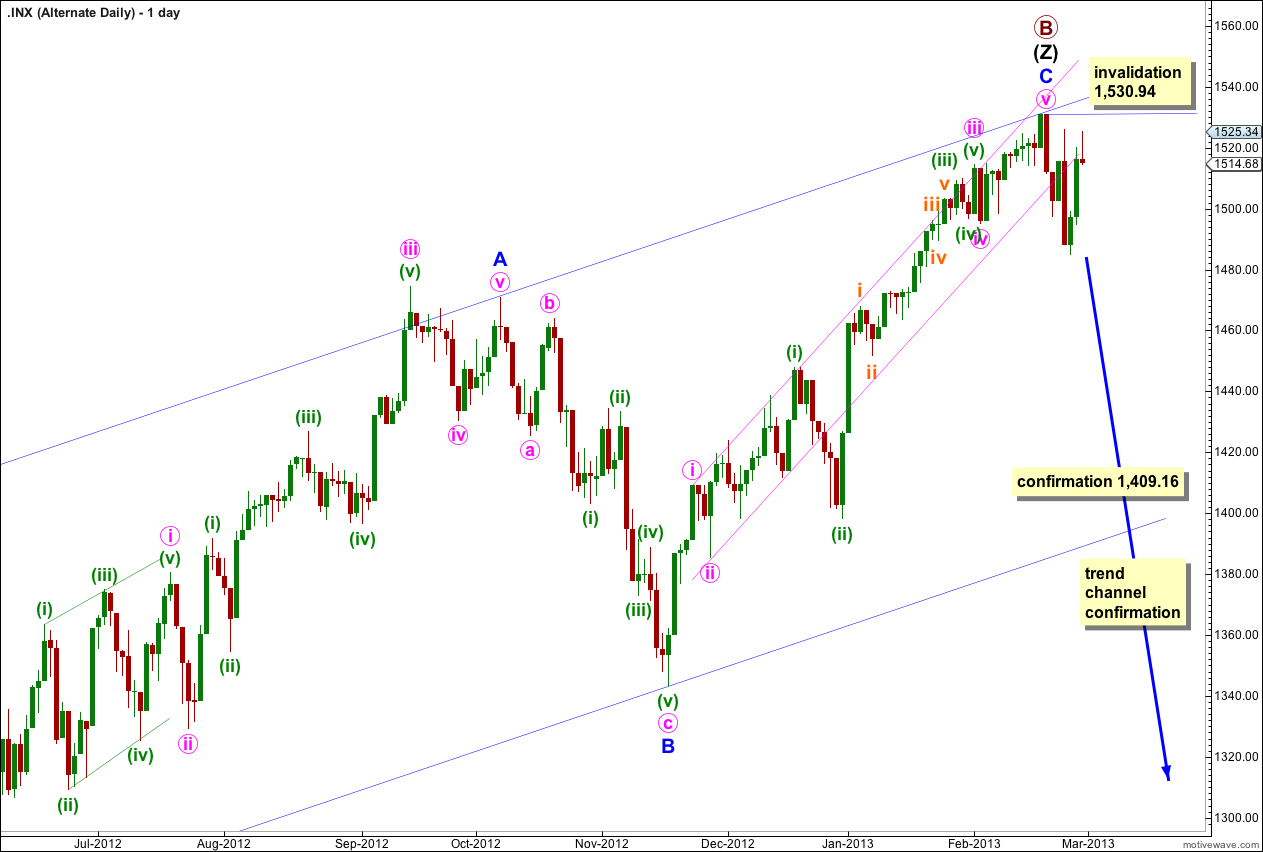
While price remains below 1,530.94 it remains possible that we have seen a big trend change at primary wave degree. The bearish engulfing candlestick reversal pattern indicates a trend change and price may have bounced off the upper edge of the wider parallel channel.
If primary wave B triple zigzag is complete then it is a 160% correction of primary wave A. This is longer than the common length, so it is a bit unusual, but it is not unrealistic. I have seen B waves within flats that are this long.
We should always assume the trend remains the same, until proven otherwise. We should assume that the main wave count is correct, the trend remains upwards, until price moves below 1,409.16 to invalidate the main wave count. At that stage this alternate would be my only wave count and I will calculate downwards targets for you.
Further downwards movement below the parallel channel about the zigzag for wave (Z) black would provide confidence in this wave count.
Because primary wave B is a triple zigzag, and the maximum number of structures in a multiple is three, once the third zigzag is confirmed as complete then the entire correction must be complete. At cycle degree I cannot see another explanation for primary wave B which would allow for further upwards movement.
Within the new downwards trend a leading diagonal for a first wave may be unfolding.
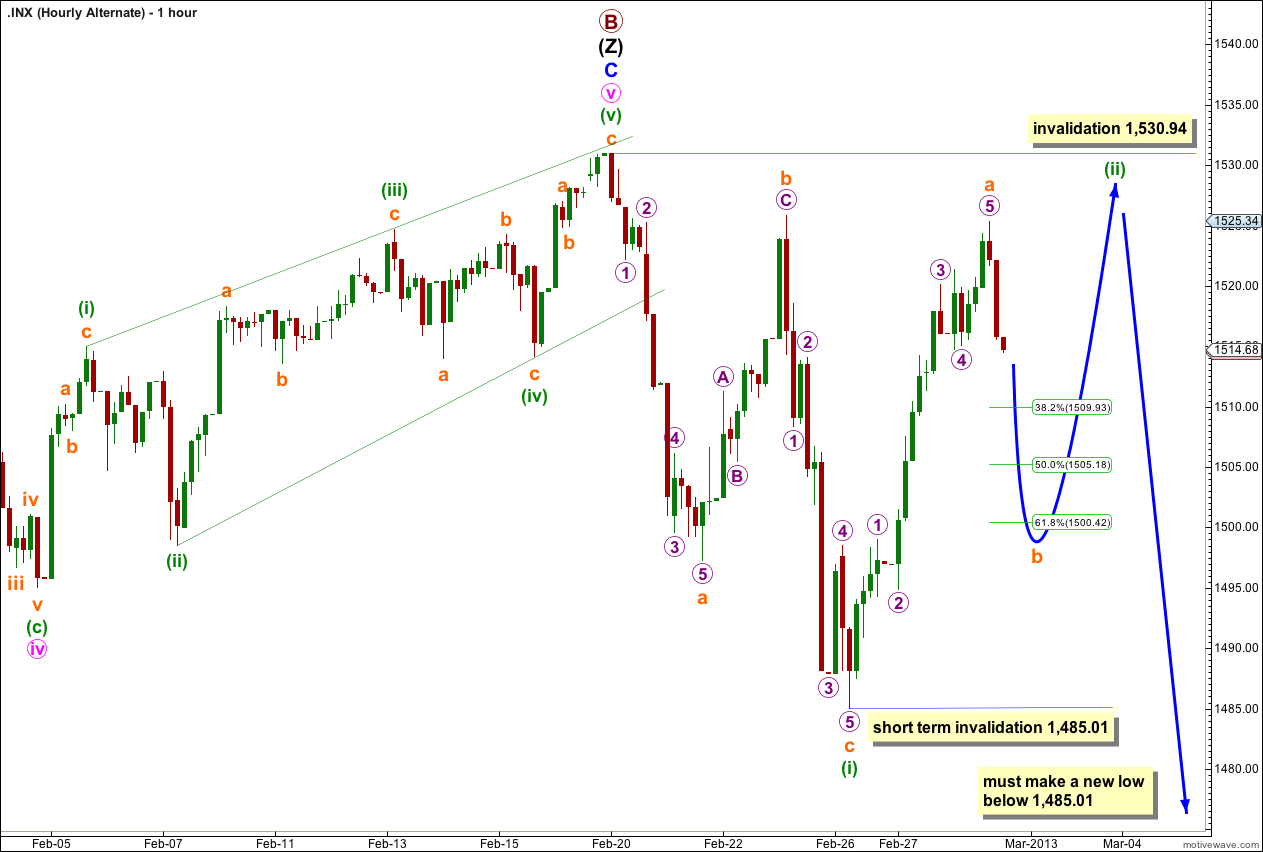
I have moved the labeling for all movement after the end of primary wave B down one degree.
Within a possible leading diagonal only the first wave minuette wave (i) may be complete.
Minuette wave (ii) would be an incomplete zigzag. Within the zigzag subminuette wave a would be complete and subminuette wave b should move price lower tomorrow.
Subminuette wave b may not make a new low below the start of subminuette wave a. This wave count also is invalidated in the short term with movement below 1,485.01.
Minuette wave (ii) may not move beyond the start of minuette wave (i). This wave count is invalidated with movement above 1,530.94.
When minuette wave (ii) is complete then minuette wave (iii) downwards must move price below the end of minuette wave (i) to a new low.
Looks like we are getting ready for a big PUSH up today