
Last analysis expected downwards movement from the S&P 500 for Thursday’s session, with a small correction along the way which should have finished during the session. This is exactly what happened.
I have two wave counts. In the short term they expect exactly the same movement next. They may not diverge yet for another couple of sessions or so.
Click on the charts below to enlarge.
Main Wave Count.
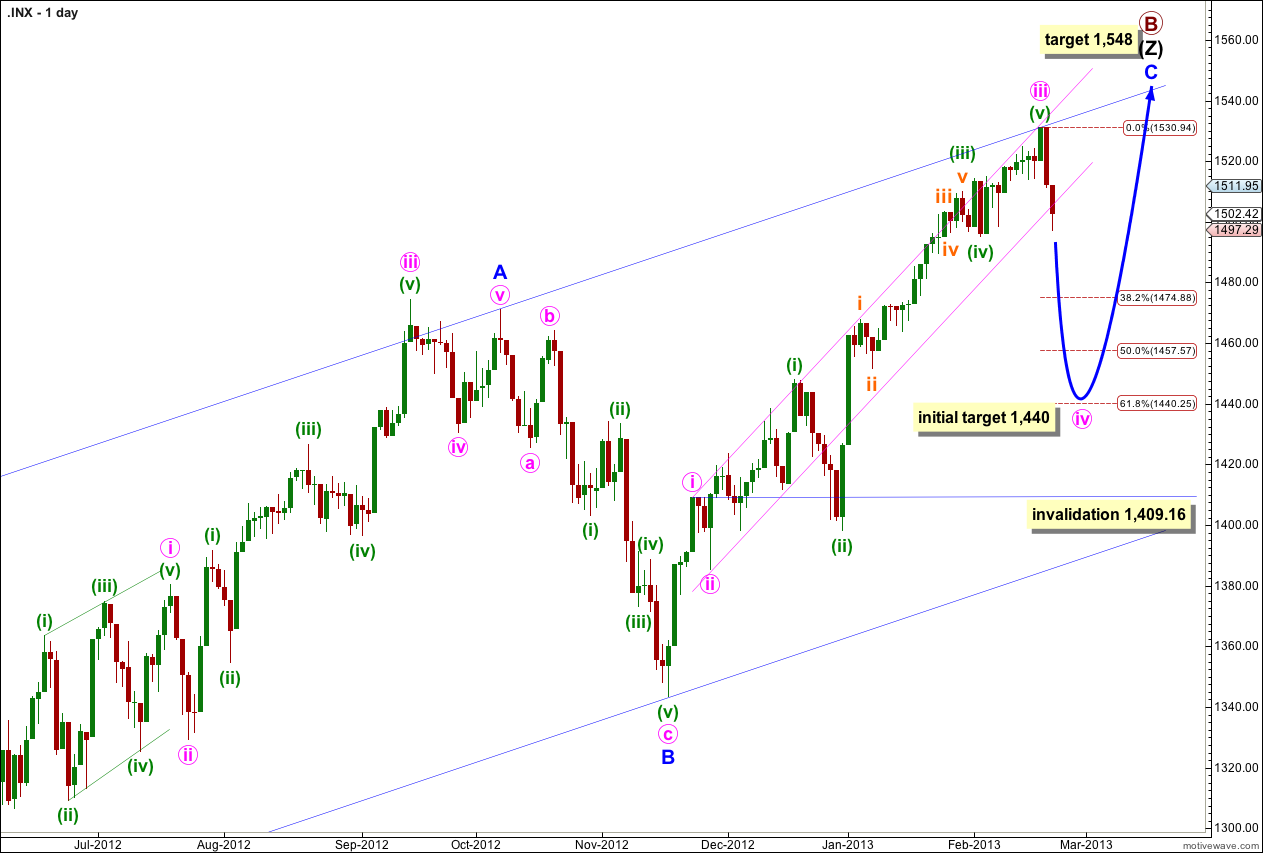
Wave iv pink should exhibit choppy overlapping downwards movement for about a week.
Because wave ii pink was a shallow 36% correction of wave i pink then wave iv pink may end about 1,440 at 0.618 the length of wave iii pink, given the guideline of alternation. Now that price has breached the narrow channel containing wave C blue it looks like we may see alternation in depth as well as structure.
Wave ii pink was a zigzag so we may expect wave iv pink to be a flat, double or triangle. A flat is most likely.
The most common type of flat is an expanded flat which has a B wave that makes a new price extreme beyond the end of the A wave. A new high above 1,530.94 is possible if wave iv pink unfolds as a flat.
If wave iii pink was over on Friday it lasted a Fibonacci 55 days. Within it wave (i) green lasted 14 days, one more than a Fibonacci 13, wave (ii) green lasted a Fibonacci 8 days, wave (iii) green lasted 20 days, one less than a Fibonacci 21, wave (iv) green lasted a Fibonacci 3 days, and wave (v) green may have had no Fibonacci duration.
This main wave count expects wave iv pink to last about a week or so. Thereafter, wave (v) pink may move price to a new high (although it does not have to) and may end again on the upper edge of the wider parallel channel containing the zigzag of wave (Z) black.
At 1,548 wave C blue would reach equality in length with wave A blue. When wave iv pink is complete I will recalculate this target at pink degree.
Wave iv pink may not move into wave i pink price territory. This wave count is invalidated with movement below 1,409.16.
If this main wave count is invalidated then the alternate below will be strongly confirmed.
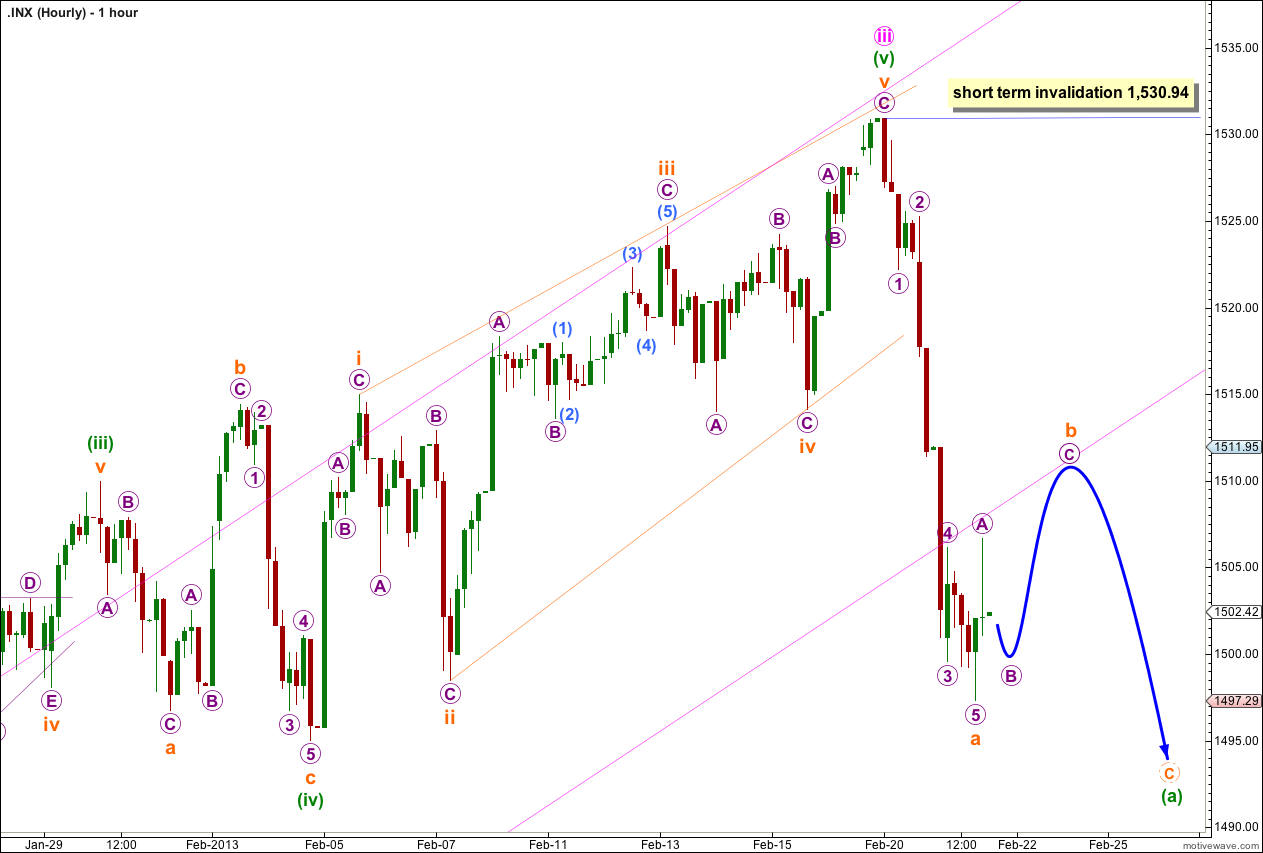
If wave iv pink is unfolding as a flat then wave (a) green within it is most likely to be a zigzag. Within it wave a orange is now complete.
Ratios within wave a orange are: wave 3 purple has no Fibonacci ratio to wave 1 purple, and wave 5 purple is just 0.1 longer than equality in length with wave 1 purple.
Within wave b orange wave A purple as seen on the five minute chart subdivides easily into a five wave impulse. This would indicate that wave b orange may unfold as a zigzag. Within it wave B purple should begin tomorrow’s session with a little more downwards movement (which should not move to a new low). Thereafter, wave C purple is highly likely to make a new high above the end of wave A purple at 1,506.65. Wave C purple to complete wave b orange may find resistance about the lower edge of the parallel channel drawn about the impulse of wave iii pink on the daily chart.
When wave b orange is complete then wave c orange should move price to new lows beyond the end of wave a orange at 1,497.29. I would expect wave c orange to be either 21 or 33 points in length.
Wave b orange may not move beyond the start of wave a orange. This wave count is invalidated with movement above 1,530.94 at this stage.
Alternate Wave Count.
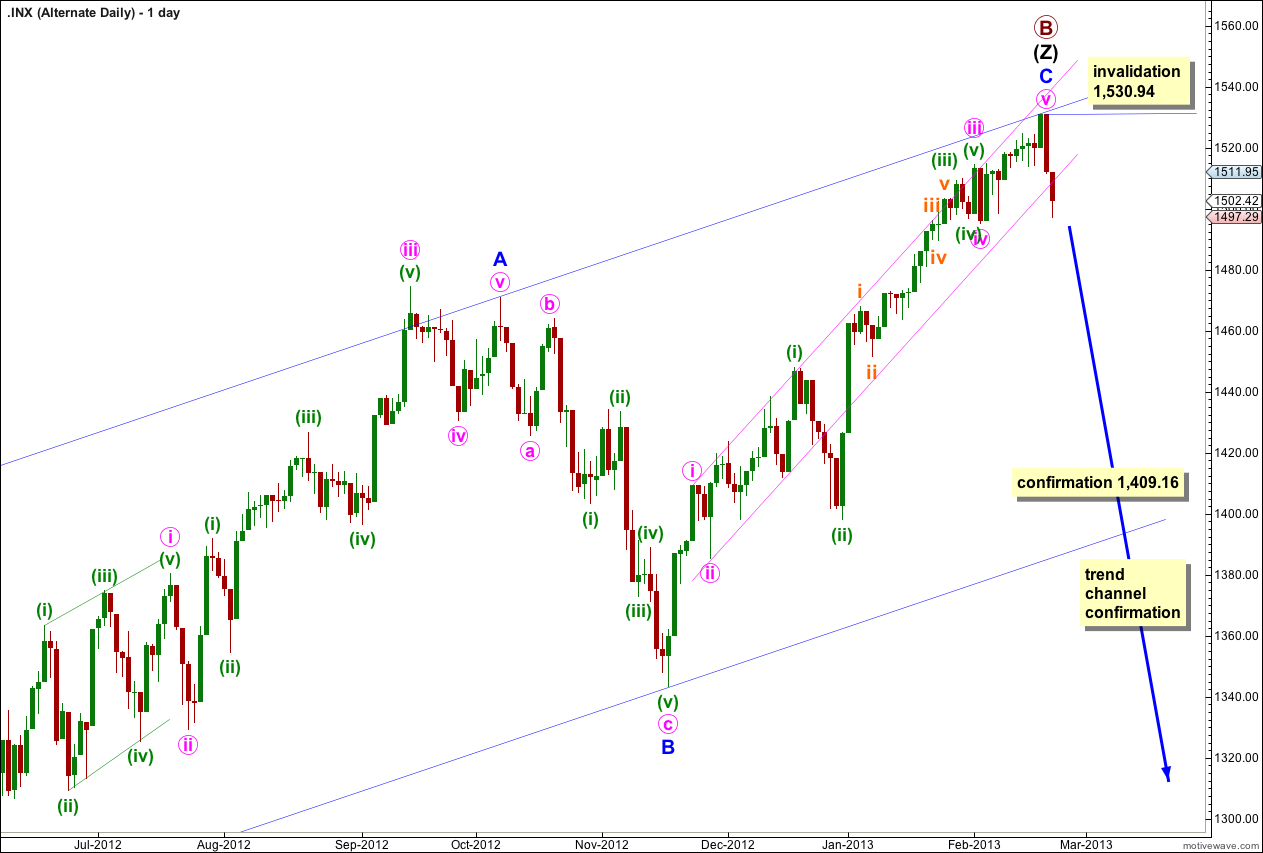
It is possible that we have seen a big trend change at primary wave degree on Friday. The candlestick reversal pattern indicates a trend change and price may have bounced off the upper edge of the wider parallel channel.
If primary wave B triple zigzag is complete then it is a 160% correction of primary wave A. This is longer than the common length, so it is a bit unusual, but it is not unrealistic. I have seen B waves within flats that are this long.
We should always assume the trend remains the same, until proven otherwise. We should assume that the main wave count is correct, the trend remains upwards, until price moves below 1,409.16 to invalidate the main wave count. At that stage this alternate would be my only wave count and I will calculate downwards targets for you.
Further downwards movement below the parallel channel about the zigzag for wave (Z) black would provide confidence in this wave count.
Because primary wave B is a triple zigzag, and the maximum number of structures in a multiple is three, once the third zigzag is confirmed as complete then the entire correction must be complete. At cycle degree I cannot see another explanation for primary wave B which would allow for further upwards movement.
This alternate is invalidated with any movement above 1,530.94.
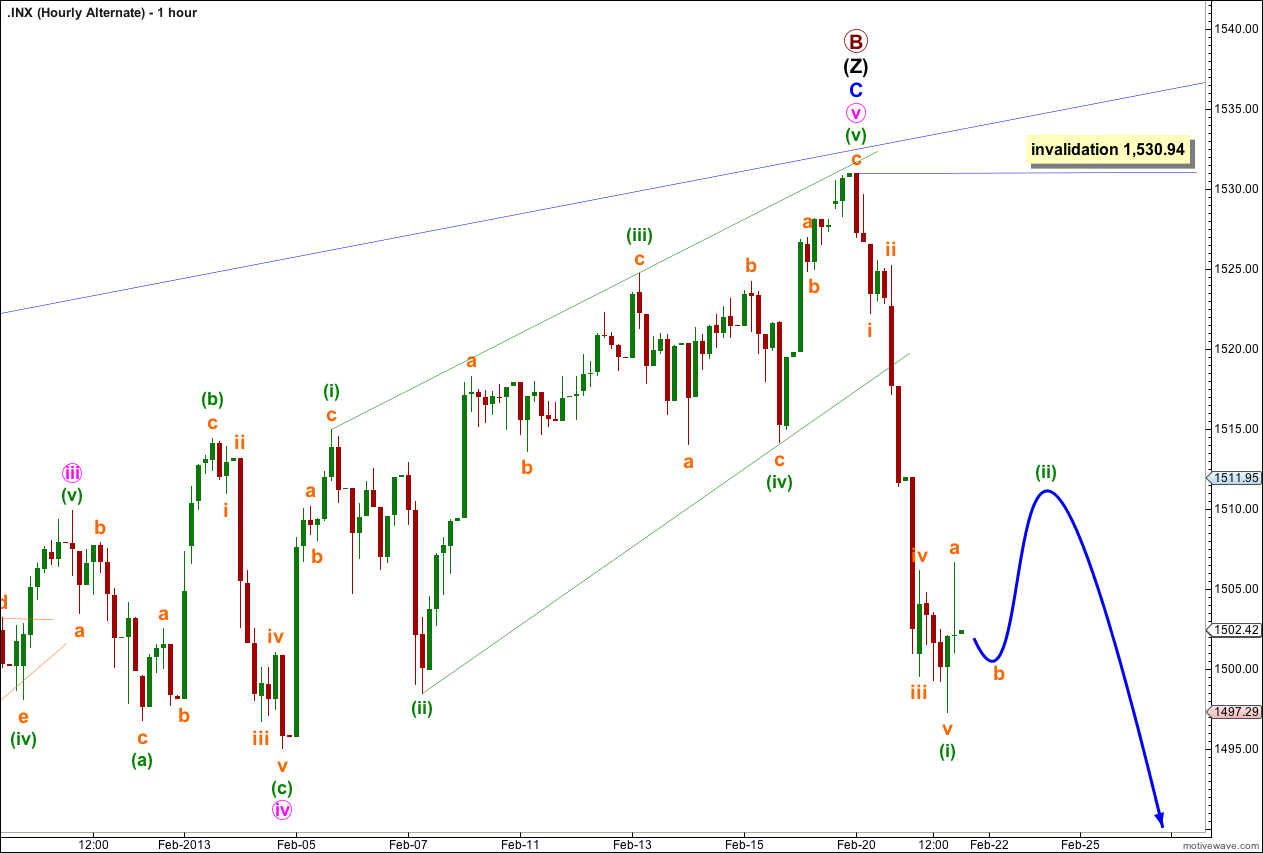
Because A-B-C has the same subdivisions as 1-2-3 both our wave counts expect exactly the same movement next.
Both B waves and second waves may not move beyond the start of A waves or first waves. Both wave counts rule out a new high in the short term.
Within wave (ii) green the structure is incomplete.
The main difference at this stage between our wave counts at hourly degree is the length and momentum of the next downwards wave. If this alternate is correct and the next wave down is a third wave we should see an increase in downwards momentum. The third wave may be 33 points or or maybe even 53 points in length.
Hi Lara
I meant can’t see it. Apologies
Hi Lara
A new mobile version for a new trend?
The problem is I can see the videos. I assume its because Android doesnt work with flash?
Until today I could always play the vids.
Not being able to see the vids has been applicable on the ewfx site for a while now. I mentioned it to hugo but no changes made. It seems odd to me since android now is bigger than apple that mobile sites only want to cater for the ipod os.
Any chance of going back using the if it aint broke dont fix it axiom?
VIX closing over BB line http://stks.co/s3Gu NYMO closing under lower BB line http://stks.co/q3Io which are buy alerts when they come back inside the BB line = new trend up