
Movement to a new high above 1,514.41 invalidated the main wave count and confirmed the alternate. We have just the one wave count again and the target is the same as yesterday.
The structure again must be incomplete.
Click on the charts below to enlarge.
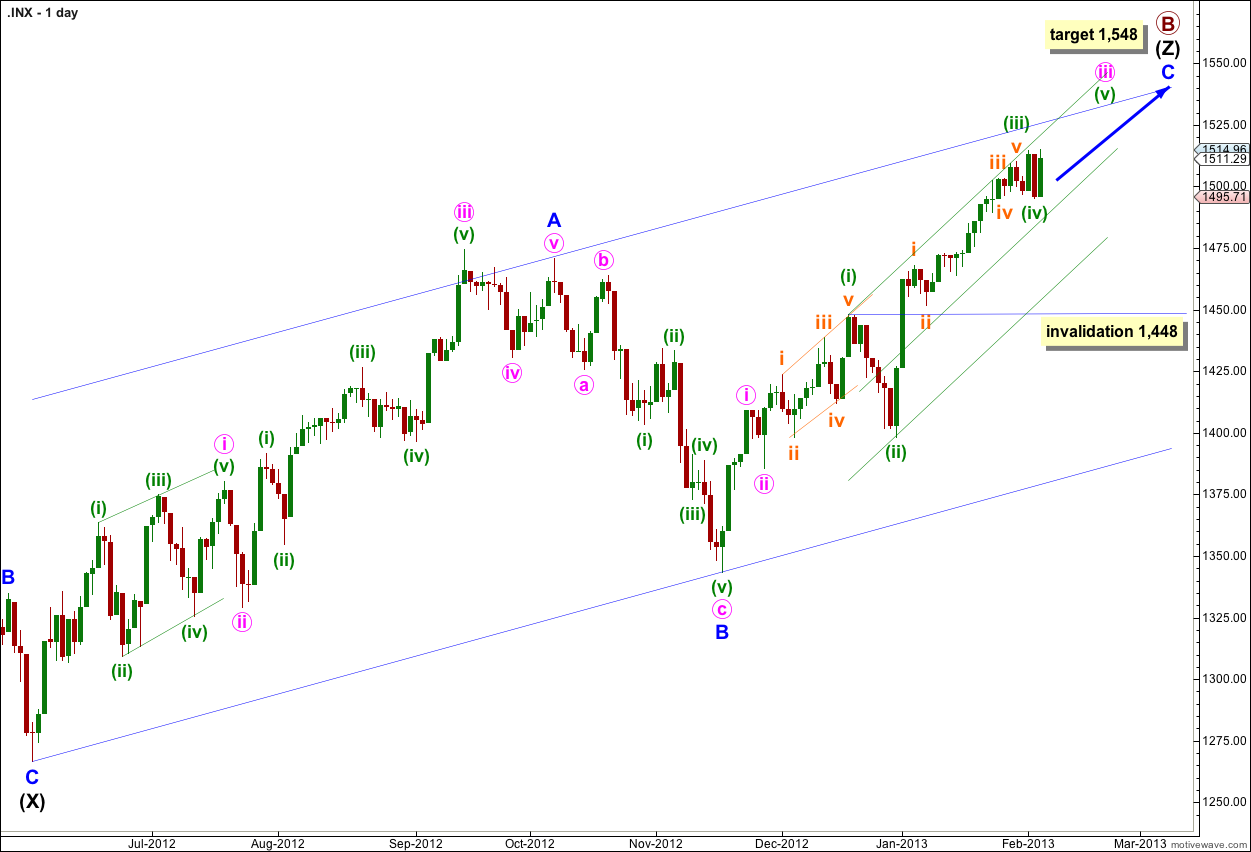
The structure for primary wave B is a triple zigzag. Because three is the maximum number of structures within a multiple when this third zigzag is finally complete then the entire correction for primary wave B must be complete. There is no other Elliott wave structure which could allow for upwards movement within this wave count at cycle degree.
Wave (Z) black is again incomplete as an exaggerated zigzag, wave C blue within it is incomplete.
Wave A blue must be truncated to subdivide into a five wave structure.
Wave A blue lasted 87 days (2 short of a Fibonacci 89). Wave B blue lasted 28 days. Wave C blue so far has lasted 53 days. In two more days it will be a Fibonacci 55 and may possibly end there.
Within wave iii pink of wave C blue there are some interesting Fibonacci time relationships: wave (i) green lasted 14 days (one more than a Fibonacci 13), wave (ii) green lasted a Fibonacci 8 days, wave (iii) green lasted 20 days (one less than a Fibonacci 21) and wave (iv) green may have been over in a Fibonacci 3 days. If wave (v) green lasts two more sessions it would have lasted a Fibonacci 3 days.
At 1,548 wave C blue would reach equality with wave A blue. At that point primary wave B would be a 166% correction of primary wave A. This target may be too high. When waves iii and iv pink are complete I will recalculate the target based upon pink wave degree.
I have used Elliott’s channeling technique to draw a channel about wave (Z) black zigzag. Price may find resistance at the upper edge of the channel.
Within wave iii pink wave (iv) green may not move into wave (i) green price territory. This wave count is invalidated with movement below 1,448.
I have drawn a double wide channel about wave iii pink: draw the first trend line from the highs of waves (i) to (iii) green then place a parallel copy upon the low of wave (ii) green. Place a second parallel copy mid way within the channel. Price may remain within the upper half of the channel and may find resistance at the upper trend line.
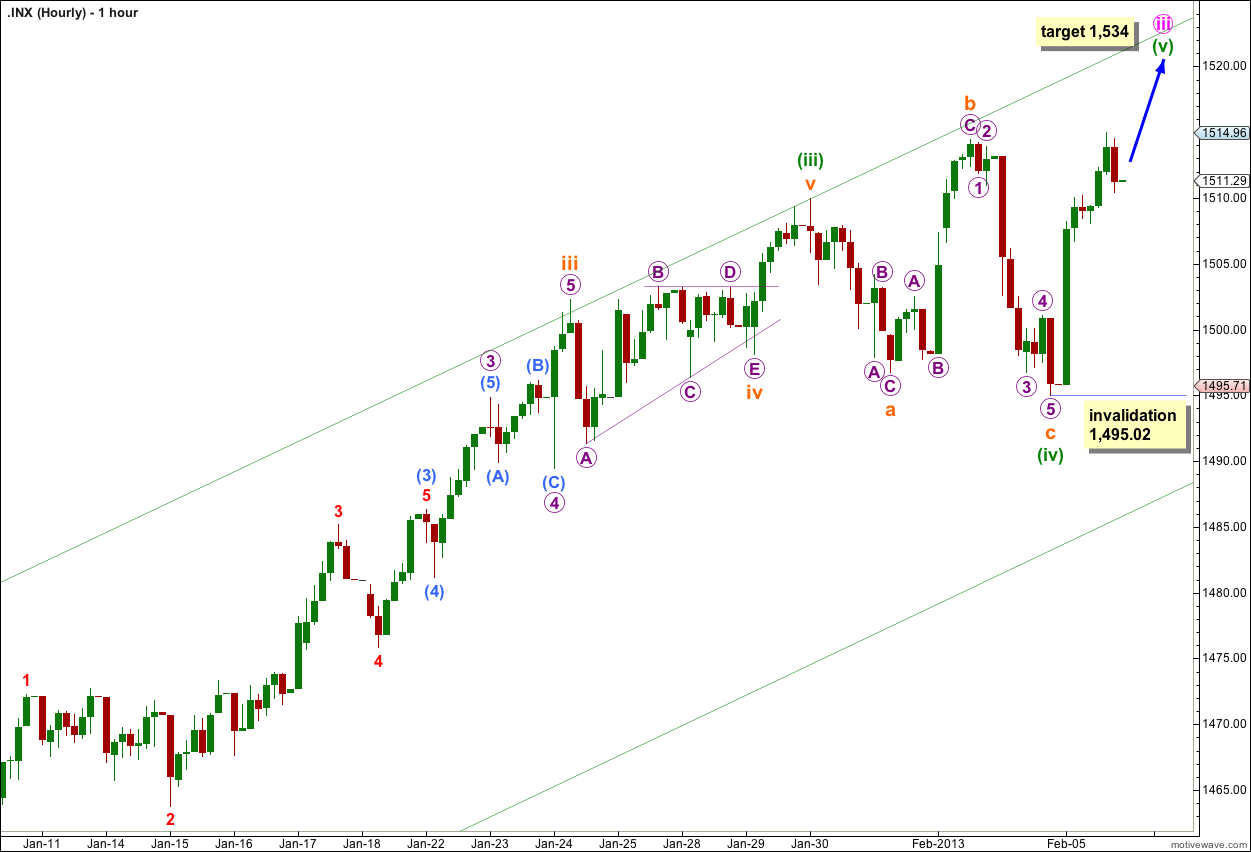
Wave (iv) green may have been over as an expanded flat correction; wave b orange is a 134% correction of wave a orange and wave c orange has no adequate Fibonacci ratio to wave a orange.
Wave (v) green within wave iii pink would reach 0.618 the length of wave (i) green at 1,534. Thereafter, we may expect more sideways movement for another fourth wave correction.
Within wave (v) green wave ii orange may not move beyond the start of wave i orange. This wave count is invalidated with movement below 1,495.02.
If this wave count is invalidated with downwards movement then it would most likely be wave (iv) green continuing sideways as a double flat or double combination. At that stage we would expect mostly sideways movement, and the invalidation point would move down to where it is on the daily chart at 1,448.
Ascending Triangle formation could we still be in Wave 4 ?
http://thepatternsite.com/at.html
I’ve read that description you link to of an ascending triangle.
Read the explanation of triangles in Frost and Prechter’s “Elliott Wave Principle” (10th edition) pages 49 – 50 and 90 – 91. You will see that not only does Elliott wave outline the expected form and function of triangles but the rules are much clearer than Bulkowski’s ascending triangles.
This is not a triangle.