
The S&P 500 has moved higher again as expected from yesterday’s analysis almost reaching the target at 1,504.
I have the same daily wave count and two hourly wave counts for you today. We need to use confirmation / invalidation points to work with the two hourly wave counts, and the channel on the daily chart to confirm a trend change. Until we have confirmation of a trend change we should assume that the trend remains the same.
Click on the charts below to enlarge.
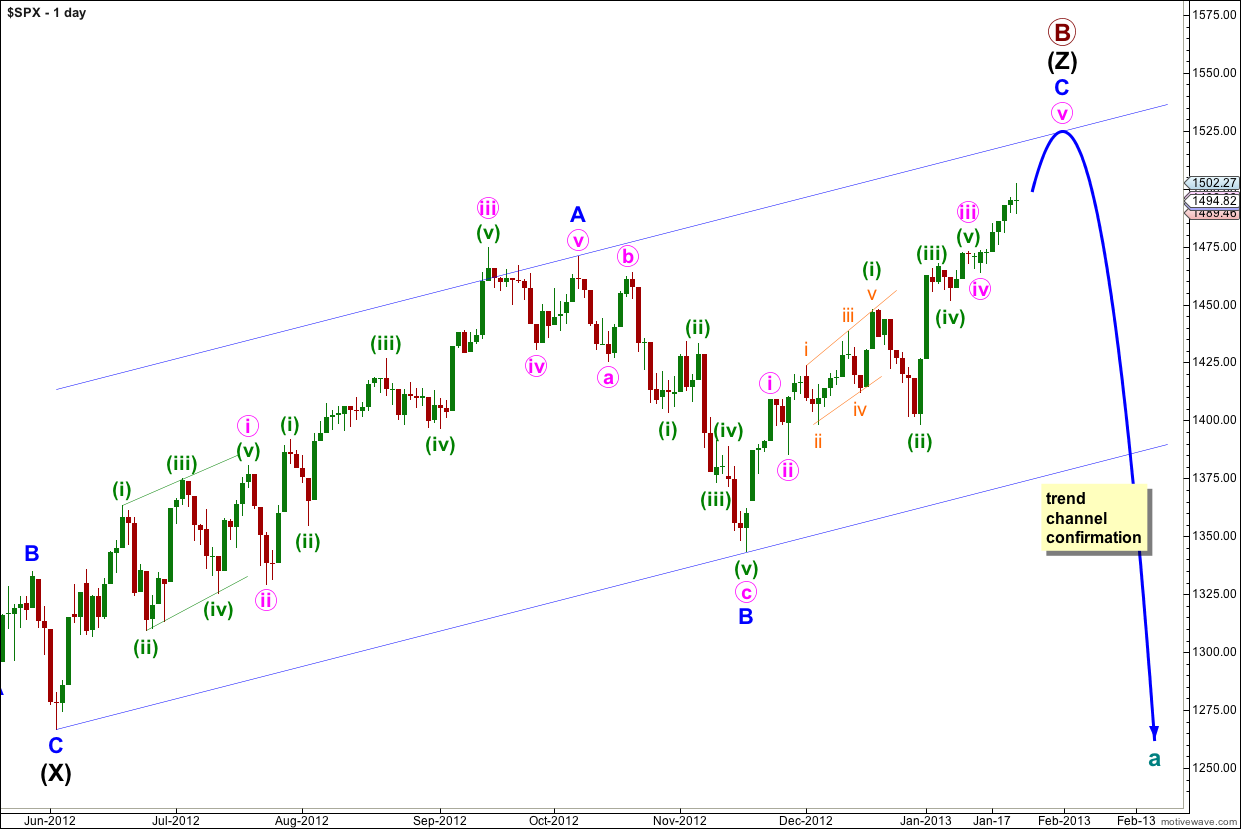
The structure for primary wave B is a triple zigzag, and price is now within the third zigzag in the triple labeled wave (Z) black. Because three is the maximum number of structures within a multiple when this third zigzag is finally complete then the entire correction for primary wave B must be complete. There is no other Elliott wave structure which could allow for upwards movement within this wave count at cycle degree.
Wave (Z) black may now be complete as an exaggerated zigzag.
Wave A blue must be truncated to subdivide into a five wave structure.
Primary wave B is now a 150% correction of primary wave A. If primary wave B reaches twice the length of primary wave A at 1,644 although the wave count is not technically invalidated at that point the probability would be so low it should be discarded. At that stage I would switch the monthly wave count to the alternate expanding triangle wave count, which requires a new all time high.
Wave A blue lasted 87 days (2 short of a Fibonacci 89). Wave B blue lasted 28 days. So far wave C blue has lasted 45 days. It may continue for another 10 sessions to last a Fibonacci 55 days.
I have used Elliott’s channeling technique to draw a channel about wave (Z) black zigzag. When this channel is breached by downwards movement we shall have trend channel confirmation of a trend change.
Main Hourly Wave Count.
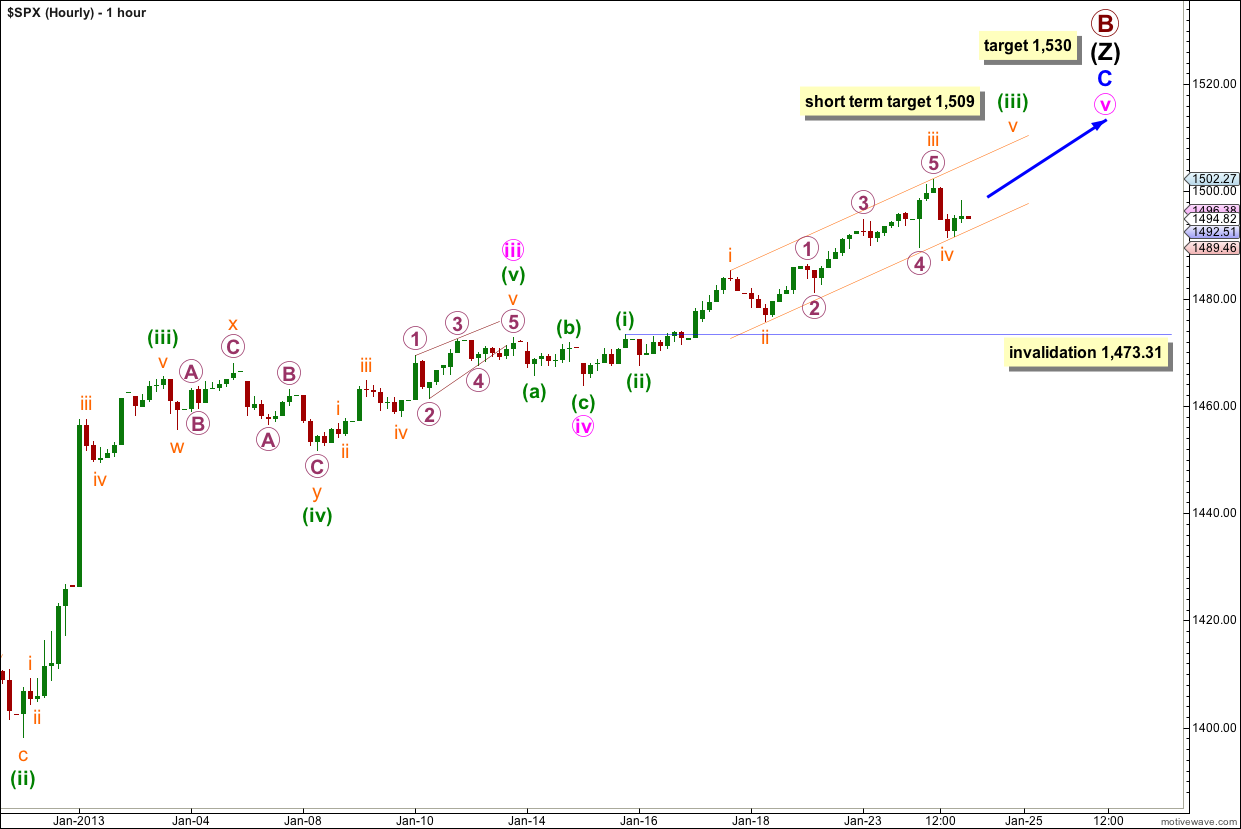
There is continuing divergence on the one and two hour time frames. MACD agrees with this wave count. This trend looks like it is expiring.
However, we should assume that the trend remains the same until proven otherwise. For this reason the main hourly wave count will expect more upwards movement.
There are several possibilities for labeling within wave v pink. This wave count follows the most common scenario of an extended third wave.
Wave (iii) green may not have a Fibonacci ratio to wave (i) green and so wave (v) green may reach equality with wave (i) green and be 9.55 points in length.
Within wave (iii) green wave iii orange is 1.95 points short of 1.618 the length of wave i orange. At 1,509 wave v orange would reach equality in length with wave i orange.
When wave (iii) green is complete then wave (iv) green may not move into wave (i) green price territory. This wave count is invalidated with movement below 1,473.31.
Alternate Hourly Wave Count.
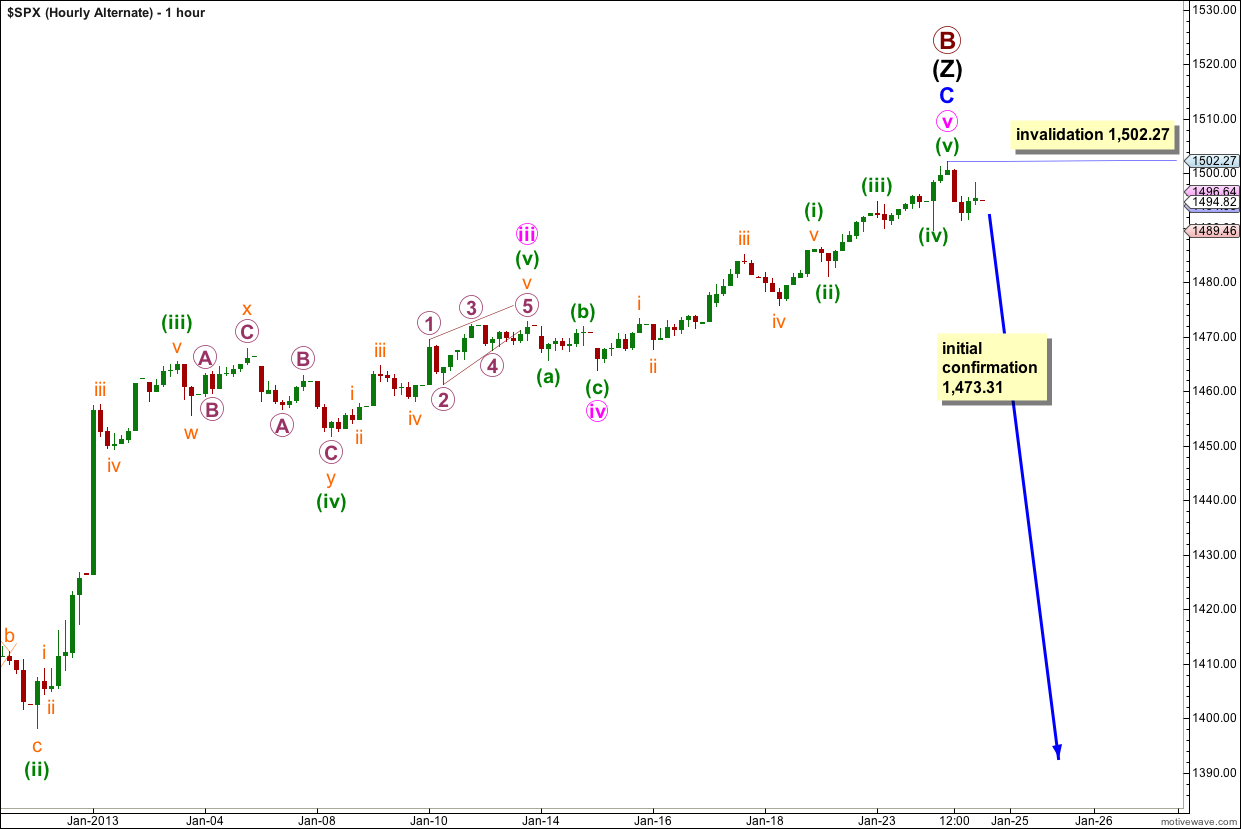
If price does not continue higher and moves below 1,473.31 then this alternate wave count may be considered. However, we would still need trend channel confirmation of a trend change on the daily chart to have confidence in it.
If primary wave B is complete then it is a 150% correction of primary wave A.
There is no Fibonacci ratio between waves A and C blue within the zigzag of wave (Z) black.
Ratios within wave C blue are: there is no Fibonacci ratio between waves i and iii pink, and wave v pink is 2.15 points short of 0.618 the length of wave i pink.
Ratios within wave v pink are: wave (iii) green is just 0.04 points short of 0.618 the length of wave (i) green, and wave (v) green has no Fibonacci ratio to either of waves (i) or (iii) green.
Any movement to a new high above 1,502.27 would invalidate this alternate wave count and give more confidence to the target on the main wave count.
I sent you an updated chart a few mins ago… please let me know what you think.
Thanks
I still think the current expanding Triangle appears to be wave-e of a larger expanding Triangle (which is itself wave-e of an even larger expanding Triangle). To prove this interlocking group of expanding Triangles, an explosive, upside acceleration must materialize to end the Major Wave B
To be certain of what you are meaning I need a chart, showing your bigger picture too.
If you are referring to the possible triangle in the chart you sent me a week or so back, it’s not a triangle. It did not meet the rules for a triangle, and the rules are not flexible.