
The S&P 500 moved higher as expected during Friday’s session. The wave count remains the same and is valid.
I have two hourly charts for you to end the week, and I will recap the main monthly wave count which this daily wave count is based upon.
Click on the charts below to enlarge.
Main Monthly Wave Count.
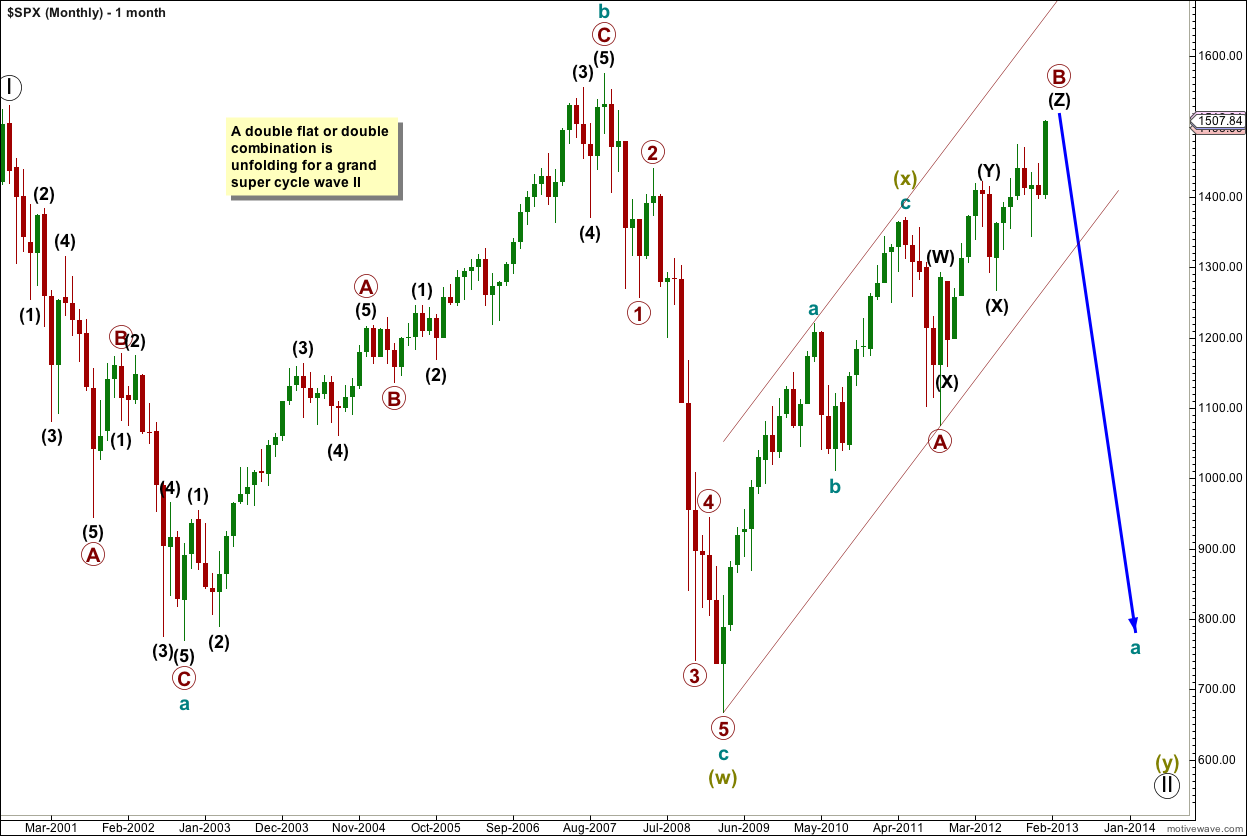
At super cycle degree we may be seeing a double flat or double combination unfolding.
Within super cycle wave (w) (olive green) cycle wave b is a 106% correction of cycle wave a, so super cycle wave (w) is an expanded flat correction.
The two structures in the double are joined by a three in the opposite direction labeled super cycle wave (x) which is a zigzag.
Super cycle wave (y) is most likely unfolding as a flat correction, and within it cycle wave a is itself unfolding as a flat. Within the flat of cycle wave a primary waves A and now likely B are over, primary wave C is extremely likely to take price to new lows below the end of primary wave A at 1,074.77 to avoid a truncation and a rare running flat.
Daily Chart.
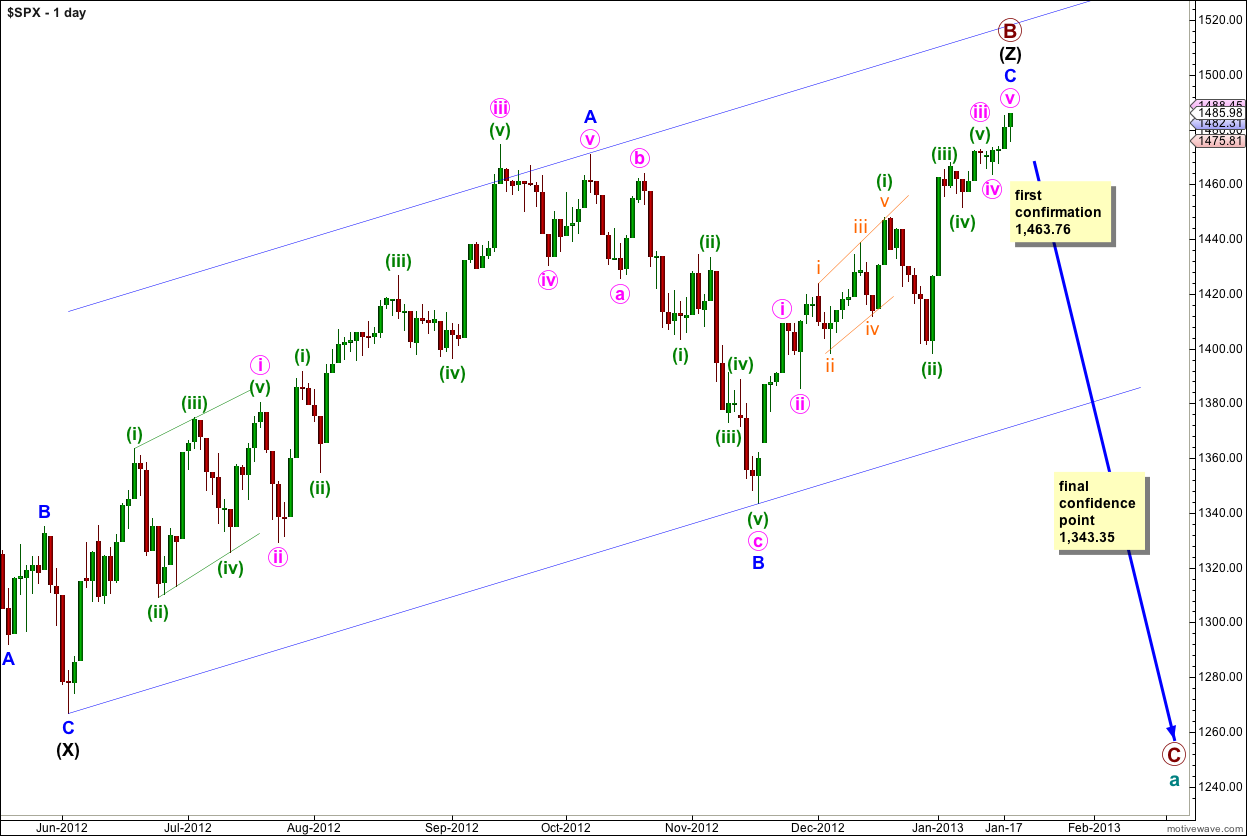
The structure for primary wave B is a triple zigzag, and price is now within the third zigzag in the triple labeled wave (Z) black. Because three is the maximum number of structures within a multiple when this third zigzag is finally complete then the entire correction for primary wave B must be complete. There is no other Elliott wave structure which could allow for upwards movement within this wave count at cycle degree.
Wave (Z) black may now be complete as an exaggerated zigzag.
Wave A blue must be truncated to subdivide into a five wave structure.
Primary wave B is a 144% correction of primary wave A, not too much longer than the maximum common length of 138%.
Wave A blue lasted 87 days (2 short of a Fibonacci 89). Wave B blue lasted 28 days. Wave C blue may have been over in 42 days, or it may continue for another week or so (see the alternate hourly wave count).
The first indication that a trend change has occurred will come with price movement below 1,463.76. Final confirmation will come with price movement below 1,343.35. At that stage downwards movement may not be a second wave correction within wave C blue and so wave C blue would have to be over.
I have used Elliott’s channeling technique to draw a channel about wave (Z) black zigzag. When this channel is breached by downwards movement we shall have trend channel confirmation of a trend change.
Main Hourly Wave Count.
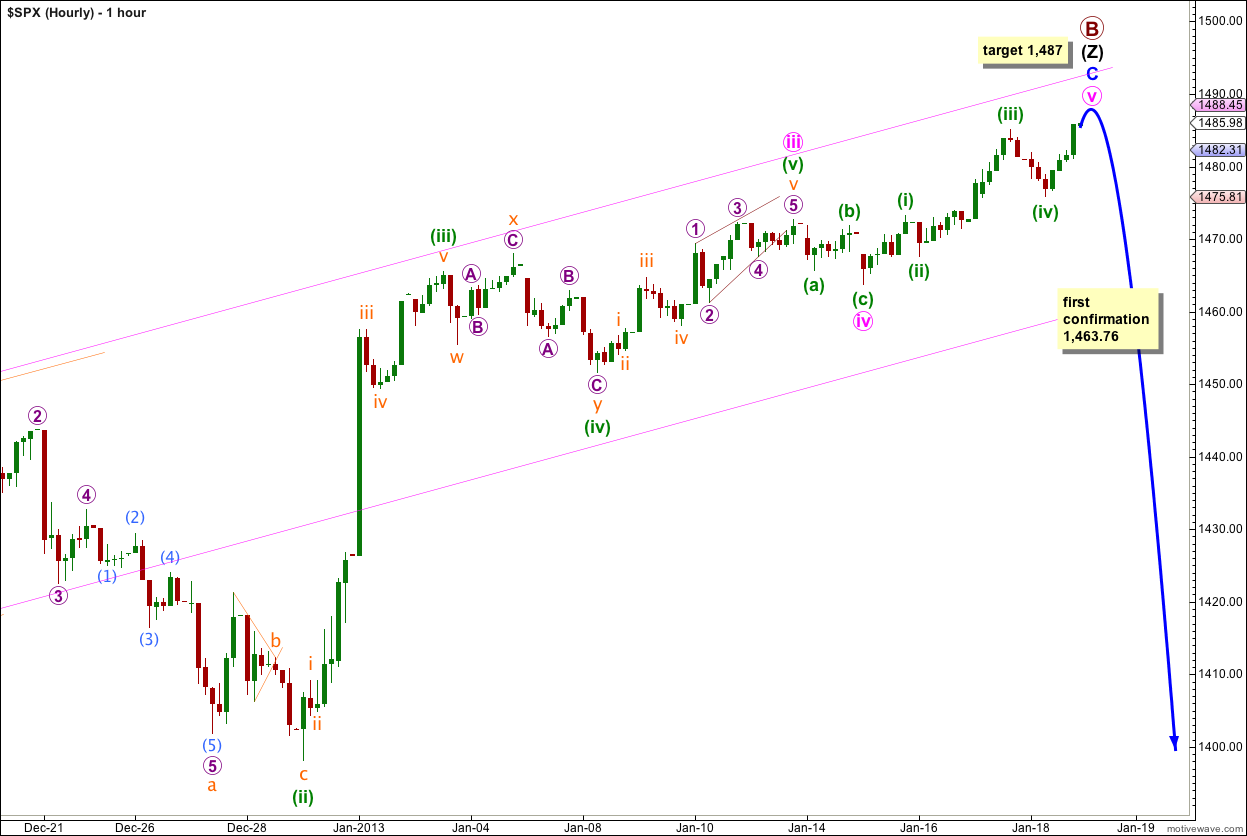
The structure of wave C blue can now be seen as a complete impulse. The final fifth wave, wave (v) green is now a complete impulse.
If price moves very slightly higher to begin the new trading week then at 1,487 wave (v) green would reach 0.618 the length of wave (iii) green.
There is not enough downwards movement at the end of Friday’s session to confirm that wave (v) green is over so we must accept that it may continue a little higher.
Movement below 1,463.76 would invalidate the alternate below and so confirm this main hourly wave count. Movement below the parallel channel containing most of wave C blue would provide some indication of a trend change also.
Alternate Hourly Wave Count.
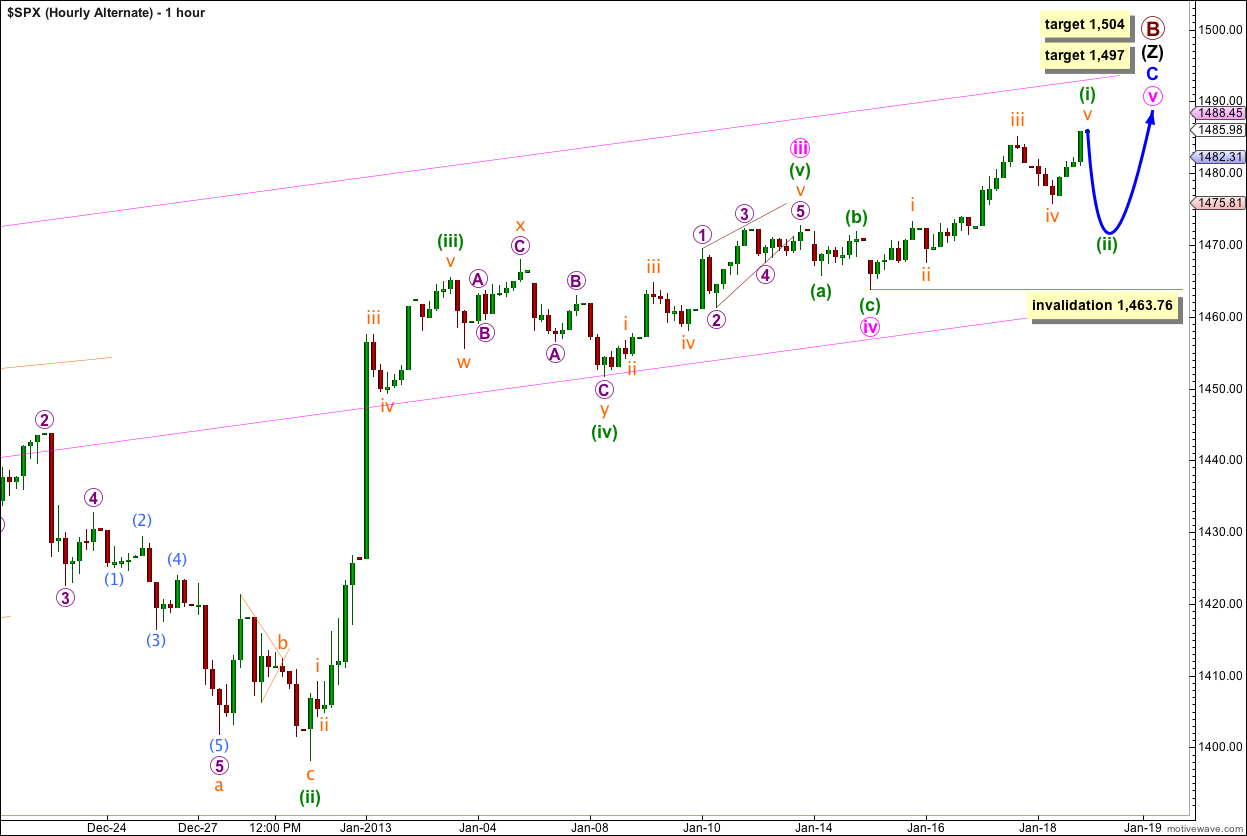
If we simply move the degree of labeling within wave v pink all down one degree we may have seen only wave (i) green within wave v pink complete.
At 1,497 wave v pink would reach 0.382 the length of wave iii pink and primary wave B would be 148% the length of primary wave A. At 1,504 wave v pink would reach 0.618 the length of wave i pink and primary wave B would be 151% the length of primary wave A. The first target has a higher probability.
Within wave v pink wave (ii) green may not move beyond the start of wave (i) green. This alternate is invalidated with movement below 1,463.76.
I reviewed the video … thank you for taking your time to make it.
no worries
Thanks
Lara,
If you have the time could you tell me what rules it failed to meet.
Thanks
Wave C may not move beyond the end of wave A, wave D may not move beyond the end of B and wave E may not move beyond the end of D.
Take a look at the video on my education page, corrective wave structures. It explains the rules clearly for you there.
Thank you …
Lara,
Are you saying expanding Triangle has to be off the table?
Thank you.
The possible expanding triangle idea you sent to me is an invalid wave count. It does not meet the rules for either an expanding or contracting triangle. It is not a triangle.