
Last analysis again expected downwards movement to the same target. Again price has moved higher and so the wave count has been changed, although it remained valid.
I have just the one daily and hourly chart for you today.
Click on the charts below to enlarge.
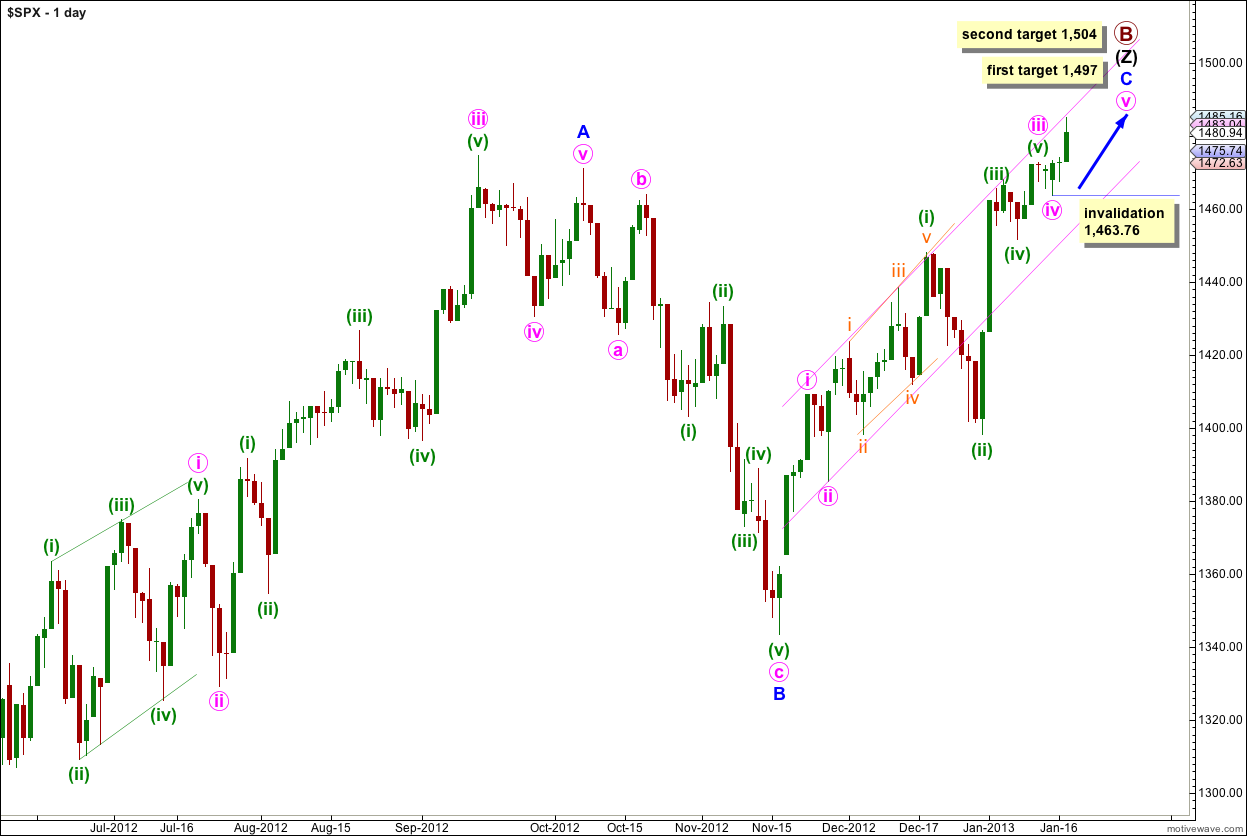
The structure for primary wave B is a triple zigzag, and price is now within the third zigzag in the triple labeled wave (Z) black. Because three is the maximum number of structures within a multiple when this third zigzag is finally complete then the entire correction for primary wave B must be complete. There is no other Elliott wave structure which could allow for upwards movement within this wave count at cycle degree.
Wave (Z) black is incomplete and is unfolding as an exaggerated zigzag.
Wave A blue must be truncated to subdivide into a five wave structure.
At 1,470 wave C blue passed 0.618 the length of wave A blue. Wave C blue has avoided a truncation.
At this time primary wave B has just passed 139% of primary wave A. It is unlikely that price will move too much higher so that primary wave B does not move too far from the common maximum length of 138% the length of primary wave A. When we know the end of waves iii and iv pink within wave C blue then I can use pink wave degree to calculate a target for this upwards movement to end.
There is no upper invalidation point for this wave count, but significant movement above 1,470 has a low probability.
Wave A blue lasted 87 days (2 short of a Fibonacci 89). Wave B blue lasted 28 days. So far wave C blue has lasted 41 days and at this stage I am expecting it to continue for another one or two sessions, and possibly up to another week.
Wave C blue is unfolding as an impulse. The structure is almost complete and requires just a very little more upwards movement.
At 1,497 wave v pink would reach 0.382 the length of wave iii pink and primary wave B would be 148% the length of primary wave A. At 1,504 wave v pink would reach 0.618 the length of wave i pink and primary wave B would be 151% the length of primary wave A. The first target has a higher probability.
Within wave v pink of wave C blue no second wave correction may move beyond the start of its first wave. This wave count is invalidated with movement below 1,463.76.
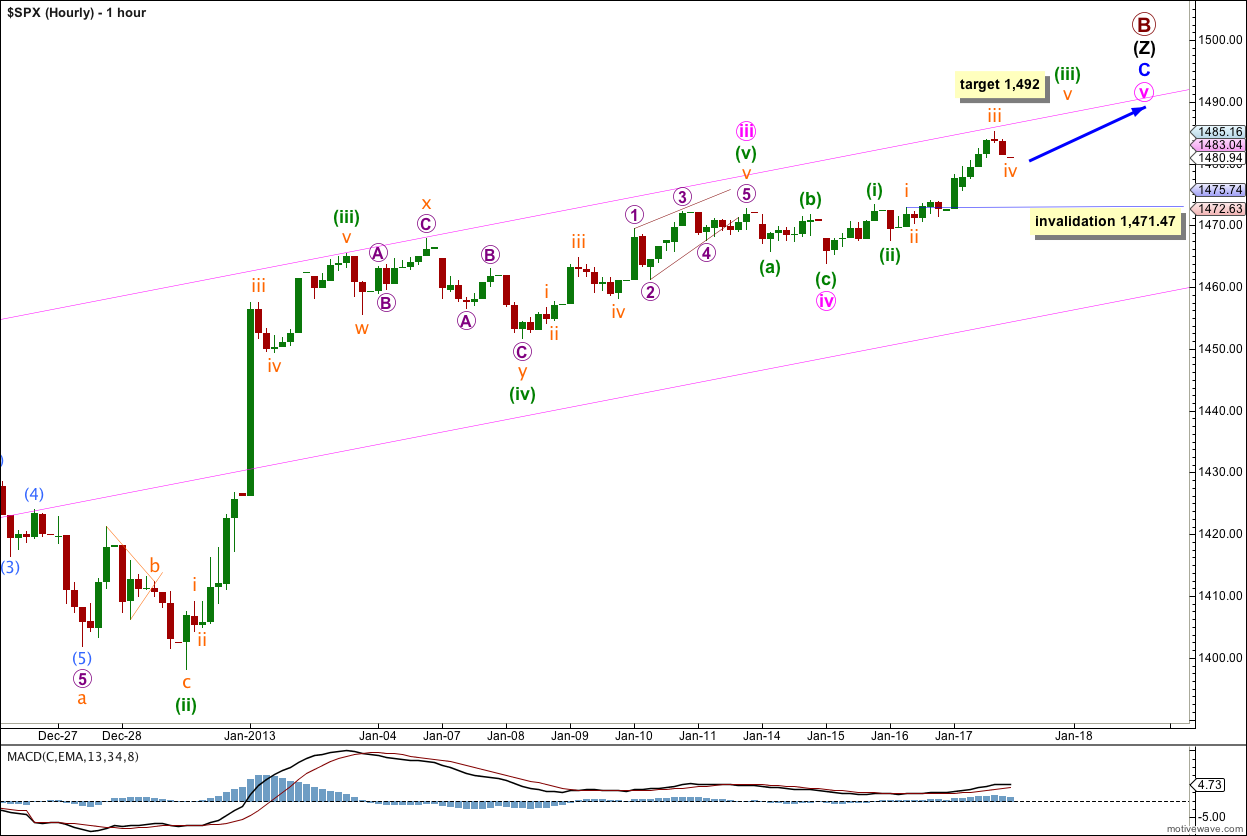
Upwards movement is extremely unlikely to be a continuation of wave iv pink and so wave iv pink is most likely to be over as a very brief shallow zigzag. The only alternation between waves ii and iv pink is the depth of the B wave within the zigzag and the overall look of it. They do not have alternation in depth, duration or the type of structure. That’s okay, alternation is a guideline and not a rule (and there is some alternation here).
With wave iv pink over price would now be within the final upwards wave to end this structure at primary degree. If this is correct we may see a very big trend change in another one session, or up to a week.
Within wave v pink wave (iii) green would be near its end. At 1,492 wave (iii) green would reach 2.618 the length of wave (i) green.
Within wave (iii) green wave iv orange may not move into wave i orange price territory. This wave count is invalidated with movement below 1,471.47.
The channel drawn here is a best fit about upwards movement with an overshoot for wave (ii) green within iii pink. Upwards movement seems to be finding resistance about the upper trend line and may continue to do so.
There is continuing divergence with price trending higher and MACD trending lower, on the one and two hourly time frames. This is further indication of an expiring trend.
This wave count agrees with MACD; the highest MACD point corresponds with the middle of wave iii pink.
When wave v pink completes this structure we may expect a trend change. At that stage movement below 1,463.76 will be the first price indicator that the trend change may have occurred.
Expanding Triangle — looks like we must push pass 1530.45
Debt ceiling extended for 3 more month the bull party will also be extended for 3 more months
Curious – Asking this because you have no upper invalidation point – How high would the S&P need to go for you to turn bullish?
Thanks – C
technically when primary B is twice the length of primary wave A then the wave count should be discarded (which is not the same as invalidated) due to a very low probability. this would occur at 1,644.
Lara,
I am wondering with the continued strong movement upwards if your monthly alternate, which sees the market in the midst of an expanding triangle, might be more likely. We are already moving well past 1470, and today’s move up was fairly strong.
Peter
That alternate still has a much lower probability. Expanding triangles are the rarest of all Elliott wave structures.