
Last analysis expected downwards movement from the S&P 500 during Wednesday’s session to a short term target at 1,459. This is not what happened as price moved higher in very slow choppy movement.
The daily wave count is the same. I have just the one hourly wave count for you today.
Click on the charts below to enlarge.
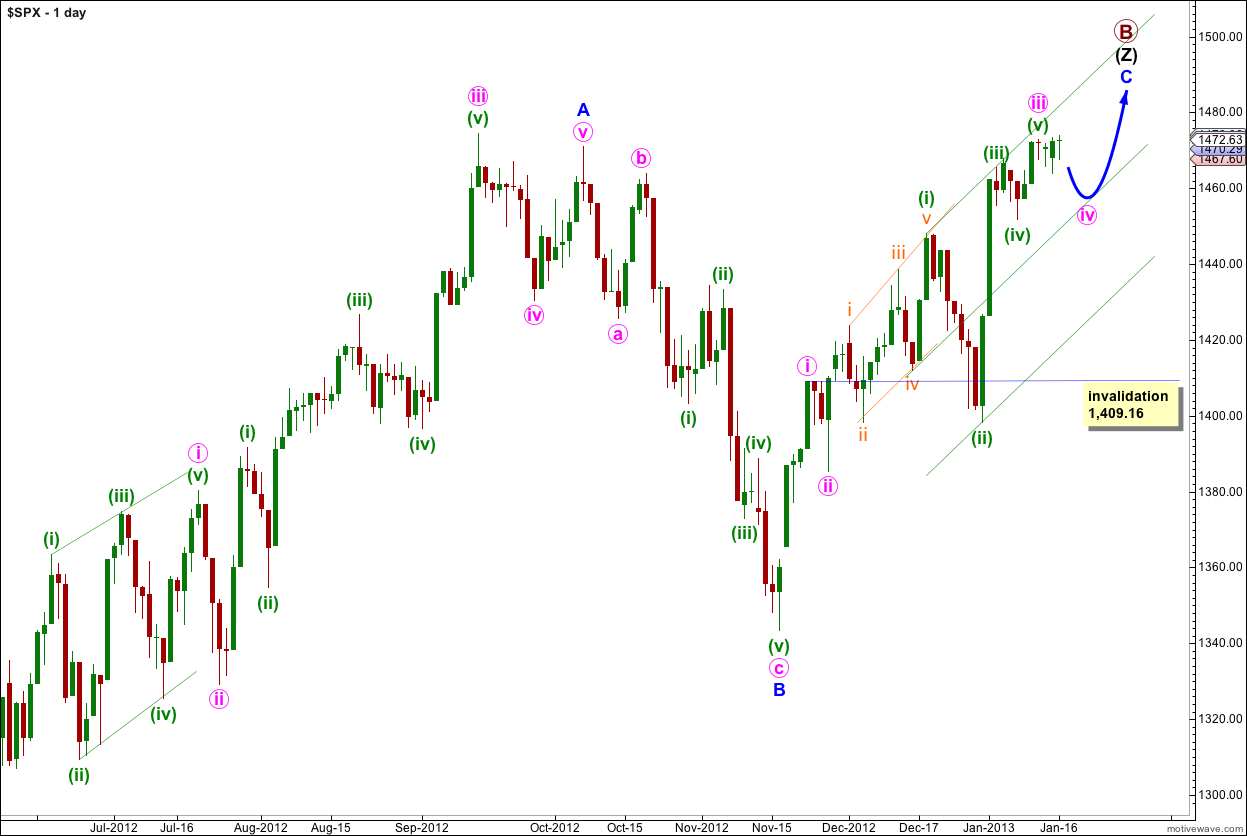
The structure for primary wave B is a triple zigzag, and price is now within the third zigzag in the triple labeled wave (Z) black. Because three is the maximum number of structures within a multiple when this third zigzag is finally complete then the entire correction for primary wave B must be complete. There is no other Elliott wave structure which could allow for upwards movement within this wave count at cycle degree.
Wave (Z) black is incomplete and is unfolding as an exaggerated zigzag.
Wave A blue must be truncated to subdivide into a five wave structure.
At 1,470 wave C blue passed 0.618 the length of wave A blue. Wave C blue has avoided a truncation.
At this time primary wave B has just passed 139% of primary wave A. It is unlikely that price will move too much higher so that primary wave B does not move too far from the common maximum length of 138% the length of primary wave A. When we know the end of waves iii and iv pink within wave C blue then I can use pink wave degree to calculate a target for this upwards movement to end.
There is no upper invalidation point for this wave count, but significant movement above 1,470 has a low probability.
Wave A blue lasted 87 days (2 short of a Fibonacci 89). Wave B blue lasted 28 days. So far wave C blue has lasted 40 days and at this stage I am expecting it to possibly continue for another one to two weeks.
Wave C blue is unfolding as an impulse. The structure is incomplete and requires overall further upwards movement.
Within wave C blue wave iv pink may not move into wave i pink price territory. This wave count is invalidated with movement below 1,409.16.
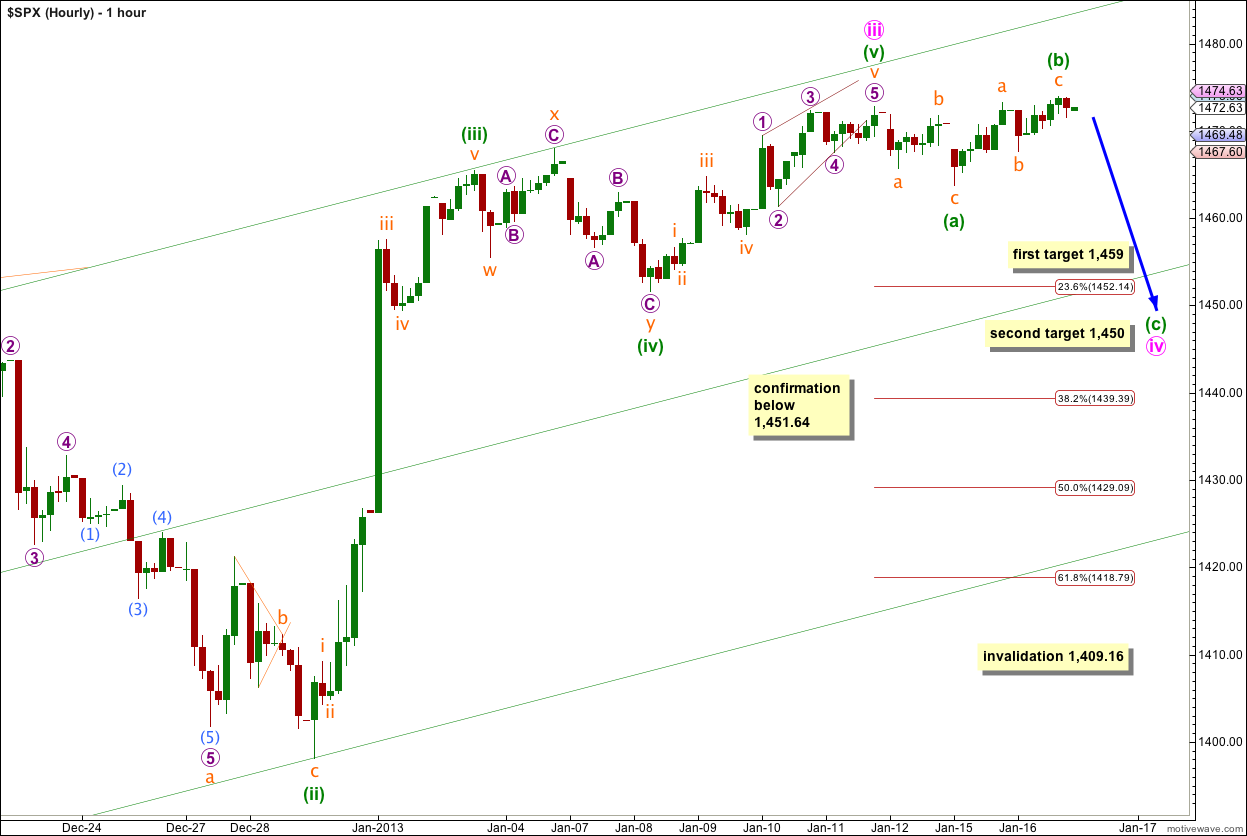
Because wave ii pink was a shallow correction I had expected wave iv pink to exhibit alternation in depth and to be deeper. However, the last three days movement indicates this may not happen. Wave ii pink was a zigzag and wave iv pink is exhibiting alternation in structure with an expanded flat.
The slow upwards movement during Wednesday’s session looks like a continuation of a B wave and so I have moved the labeling within wave iv pink up one degree. Waves (a) and (b) green may already be complete.
So far wave iv pink has lasted three sessions. If it continues for another two sessions it will complete in a Fibonacci five sessions.
Wave (b) green was a 113% correction of wave (a) green so wave iv pink is an expanded flat correction. At 1,459 wave (c) green would reach 1.618 the length of wave (a) green. If price continues lower through this first target then the next target would be at 1,450 where wave (c) green would reach 2.618 the length of wave (a) green.
When wave (c) green downwards is complete then the flat will be complete. At that stage we shall have to consider an alternate where the degree of labeling within the flat is again moved down one degree and the fourth wave may continue to move sideways as a double flat or double combination.
Wave iv pink may not move into wave i pink price territory. This wave count is invalidated with movement below 1,409.16.
Lara,
I really like how you get out the reports out at the end of day.. Thanks you!
Could you consider emailing out a mid-day chart on days like this (SPX new high 1482.38)??
Thanks again
My time zone is +13GMT. Midday New York time is currently 6am my time.