
Yesterday’s analysis expected more upwards movement from the S&P 500 during Thursday’s session. This is exactly what has happened.
The wave counts remain the same. The daily wave count is the same and we still have two hourly wave counts. The alternate hourly wave count has a much lower probability due to having a very low probability structure.
Click on the charts below to enlarge.

The structure for primary wave B is a triple zigzag, and price is now within the third zigzag in the triple labeled wave (Z) black.
Wave (Z) black is incomplete and is unfolding as an exaggerated zigzag.
Wave A blue must be truncated to subdivide into a five wave structure.
At 1,470 wave C blue passed 0.618 the length of wave A blue. Wave C blue has avoided a truncation.
At this time primary wave B has just passed 139% of primary wave A. It is unlikely that price will move too much higher so that primary wave B does not move too far from the common maximum length of 138% the length of primary wave A. When we know the end of waves iii and iv pink within wave C blue then I can use pink wave degree to calculate a target for this upwards movement to end.
There is no upper invalidation point for this wave count, but significant movement above 1,470 has a low probability.
Wave A blue lasted 87 days (2 short of a Fibonacci 89). Wave B blue lasted 28 days. So far wave C blue has lasted 36 days and at this stage I am expecting it to possibly continue for another two to three weeks.
Wave C blue is unfolding as an impulse. The structure is incomplete and requires further upwards movement.
Main Hourly Wave Count.
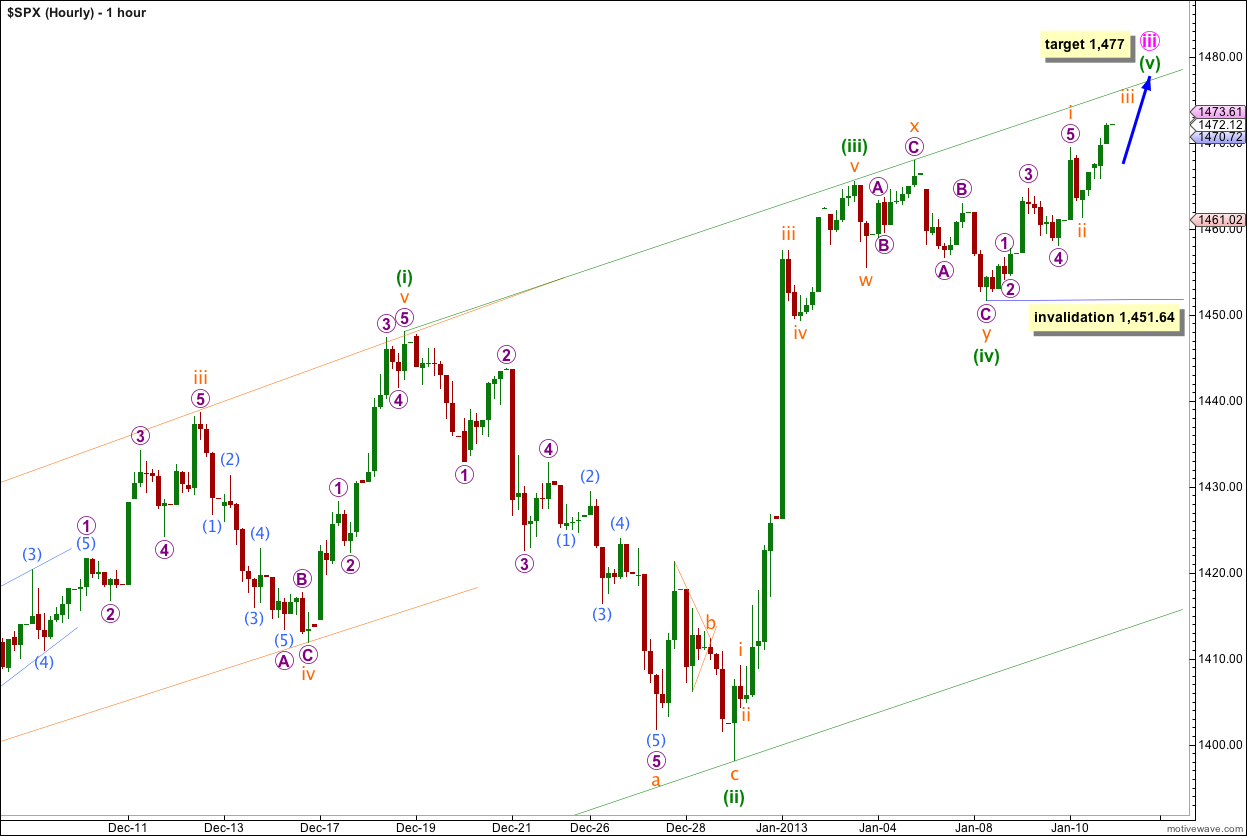
This main hourly wave count sees wave (iv) green as complete and upwards movement an unfolding fifth wave for wave (v) green to complete wave iii pink.
At 1,477 wave (v) green would reach 0.382 the length of wave (iii) green. If price continues higher through this first target then the next target would be calculated at 1,490 where wave (v) green would reach 0.618 the length of wave (i) green. However, there is already an adequate Fibonacci ratio (equality) between waves (i) and (iii) green so we may not see a Fibonacci ratio between wave (v) green and either of (i) or (iii). At this stage the best guide to where upwards movement may find resistance is the upper edge of the parallel channel.
Draw the channel using Elliott’s first technique with a trend line first from the highs of waves (i) to (iii) green, then a parallel copy upon the low of wave (ii) green.
Within wave (v) green so far on the five minute chart it looks like wave i orange may be complete at 1,469.44. There are several ways to see this incomplete structure at this stage though and this count has the best look to it. No matter how it is viewed the structure is incomplete and requires further upwards movement.
If this labeling of waves i and ii orange within wave (v) green as complete is correct then we may expect an increase in upwards momentum tomorrow as the middle of a low degree third wave unfolds.
When waves iii and iv orange within wave (v) green are complete then I can also use orange wave degrees to calculate a target to wave iii pink in its entirety to end.
Within wave (v) green no second wave correction may move beyond the start of the first wave. This wave count is invalidated with movement below 1,451.64. If this wave count is invalidated with downwards movement then use the alternate hourly wave count below.
Alternate Hourly Wave Count.
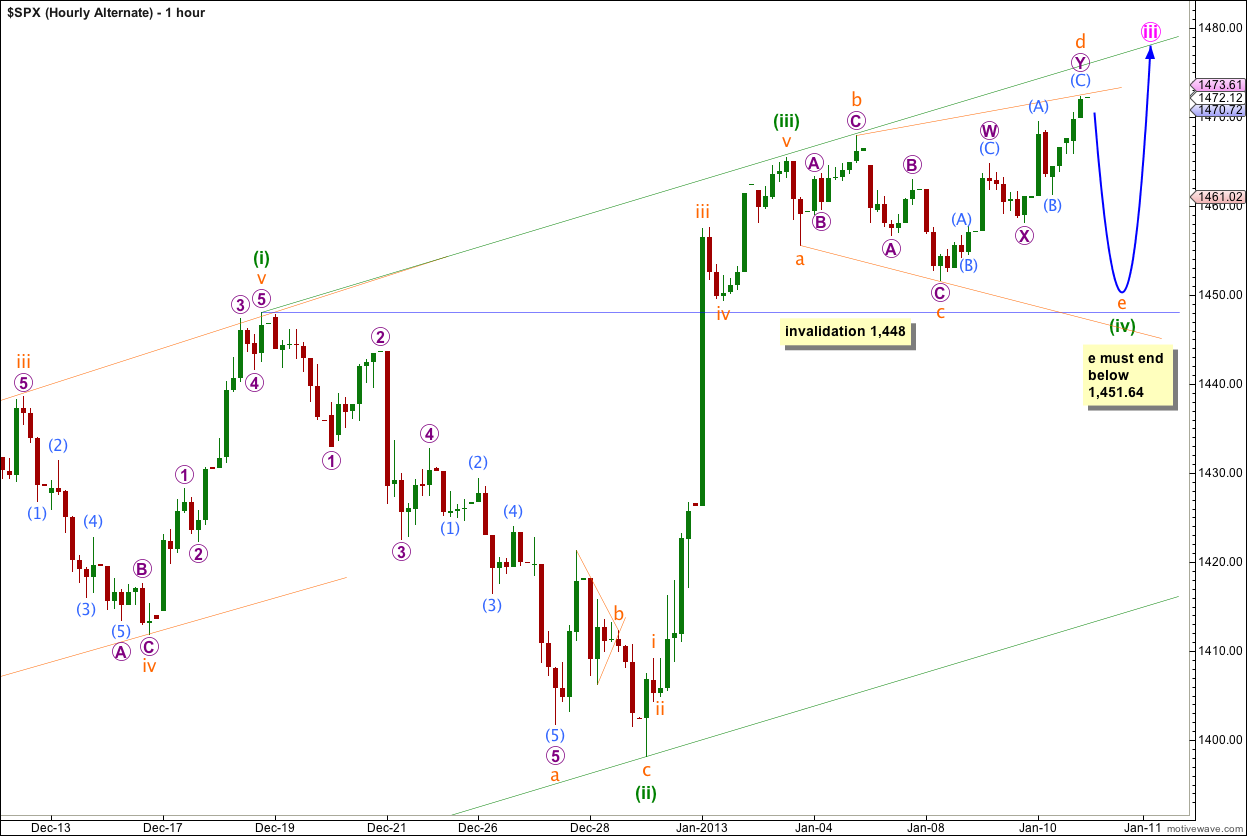
It remains possible, but very unlikely, that an expanding triangle is unfolding for wave (iv) green and that wave (iv) green is incomplete. Expanding triangles are the rarest of all Elliott wave structures which means this alternate has a very low probability. Only use it if the main hourly wave count is invalidated.
Wave d orange has moved beyond the end of wave b orange meeting the requirement for an expanding triangle. Wave d orange is just 0.58 points longer than 1.618 the length of wave b orange. Wave d orange may have subdivided into a double zigzag, meeting one of the guidelines for triangles. So far this structure has the right look.
For the triangle to complete wave e orange must end below the end of wave c orange. Downwards movement must end between 1,451.64 and 1,448. Wave (iv) orange may not move into wave (i) orange price territory.
If tomorrow price continues higher as the main wave count expects then although this alternate may not be technically invalidated it would no longer have the right look and good ratios. At that stage I would discard it.
Thank you…. emailed you back a chart
Looking at the triangle
Wave a 6/19/2012
Wave b 6/25/2012
Wave c 10/18/2012
Wave d 11/6/2012
Looking at Wave e being the longest wave into 1520.69 // 2/25/2013 then I will look for the big drop.
You do not have to post this, but could you just post a message if this could fit your count? … Thank you!
Karen, I’ve sent you an email reply.