
Last analysis expected more overall sideways movement within a limited range for Wednesday’s session, which is what happened.
The wave count remains mostly the same. At this stage I have the same one daily wave count and two hourly wave counts for you.
Click on the charts below to enlarge.
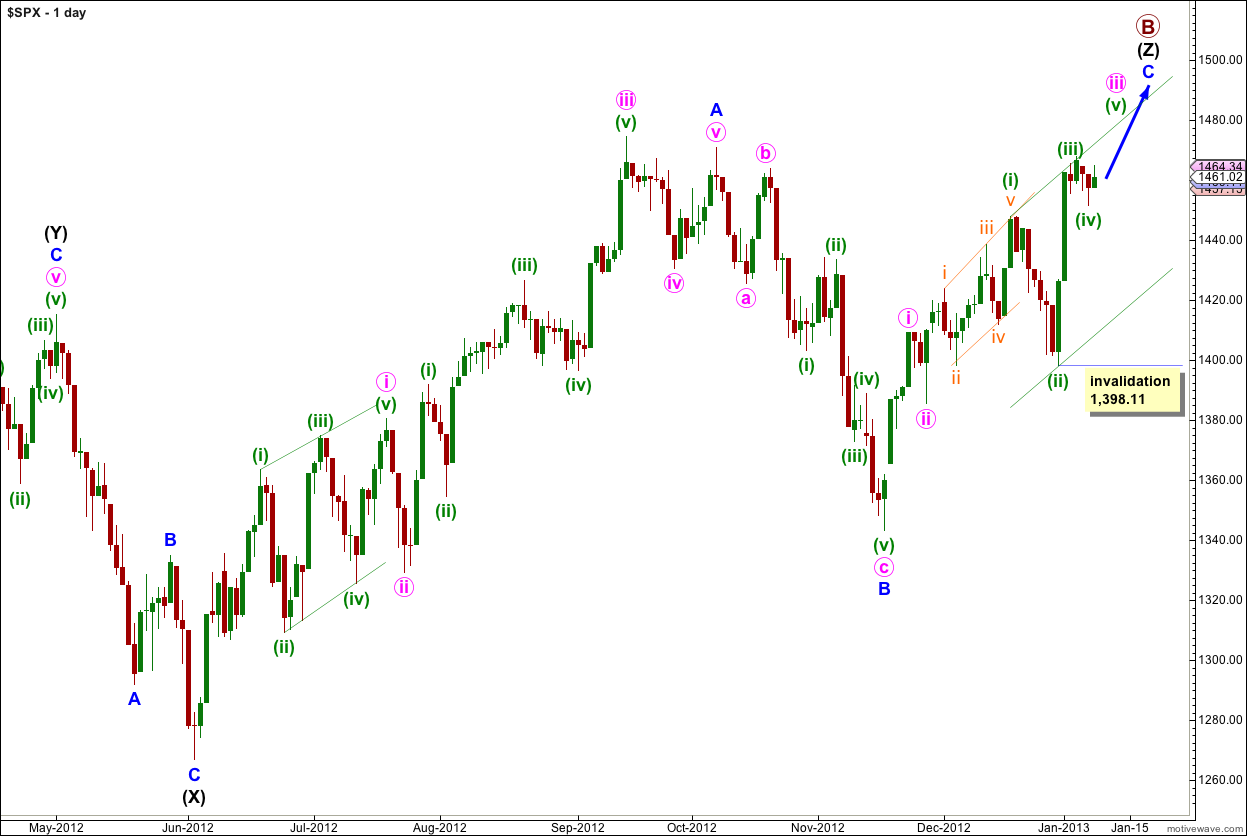
The structure for primary wave B is a triple zigzag, and price is now within the third zigzag in the triple labeled wave (Z) black.
Wave (Z) black is incomplete and is unfolding as an exaggerated zigzag.
Wave A blue must be truncated to subdivide into a five wave structure.
At 1,470 wave C blue would reach 0.618 the length of wave A blue. About this point primary wave B would also be only 139% of primary wave A. Movement to slightly above 1,470 would avoid a truncation and keep the length of primary wave B closer to the common maximum of 138%.
There is no upper invalidation point for this wave count, but significant movement above 1,470 has a low probability.
Wave A blue lasted 87 days (2 short of a Fibonacci 89). Wave B blue lasted 28 days. So far wave C blue has lasted 35 days and at this stage I am expecting it to possibly continue for another two to three weeks.
Wave C blue must subdivide into a five wave structure as either an ending diagonal or an impulse. An ending diagonal requires all subwaves to subdivide as zigzags and because the first wave upwards labeled i pink is a five wave impulse an ending diagonal may be eliminated. Wave C blue must be unfolding as an impulse. The structure is incomplete and requires further upwards movement.
Main Hourly Wave Count.
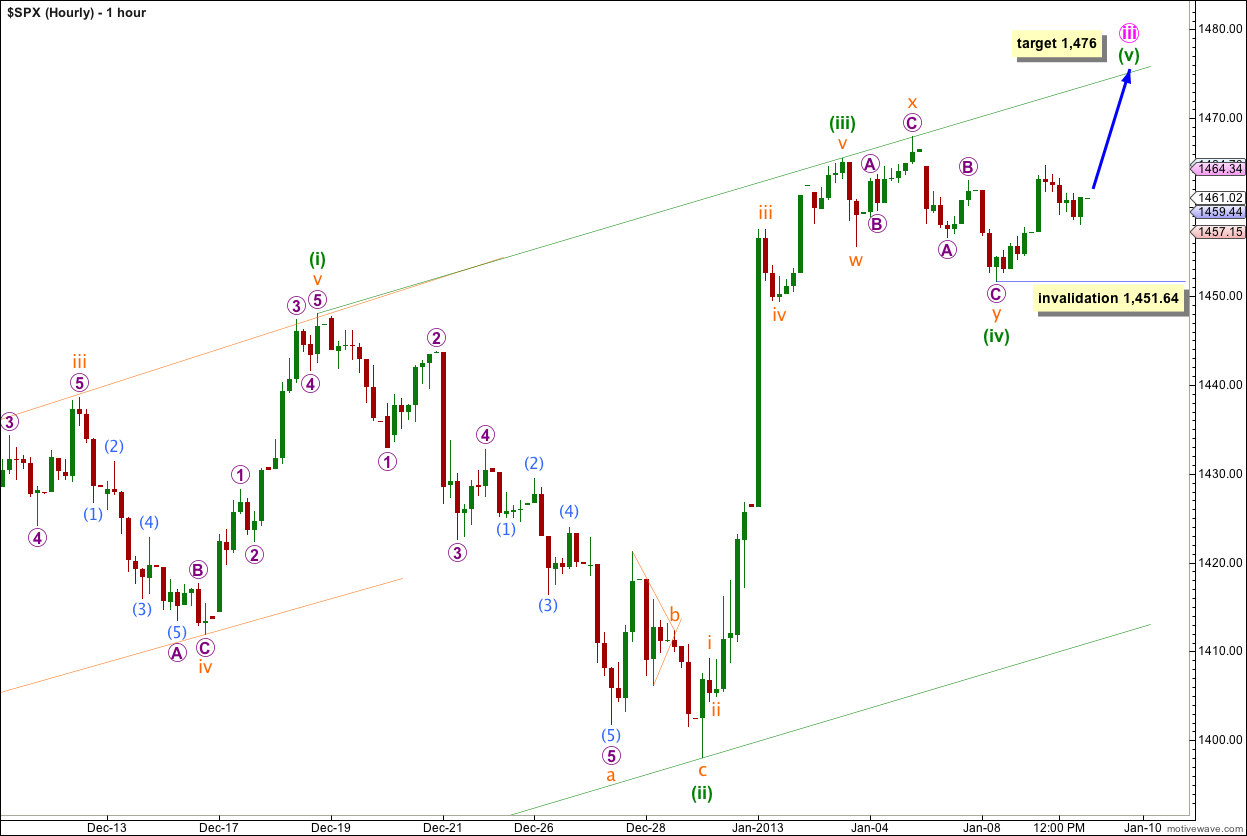
Movement above 1,462.97 invalidated the ending diagonal structure for wave c orange of wave (iv) green as it was labeled in yesterday’s analysis.
At this stage it looks like wave (iv) green may be a completed double zigzag correction lasting a Fibonacci three sessions. It cannot be a flat correction because the C wave did not subdivide as a five and movement looks strongly like a three.
If wave (iv) green is complete it has excellent alternation with wave (ii) green.
At 1,476 wave (v) green would reach 0.382 the length of wave (i) green.
Wave (v) green must subdivide into a five, either an ending diagonal or an impulse.
Within wave (v) green wave ii orange may not move beyond the start of wave i orange. This wave count is invalidated with movement below 1,451.64.
Alternate Hourly Wave Count.
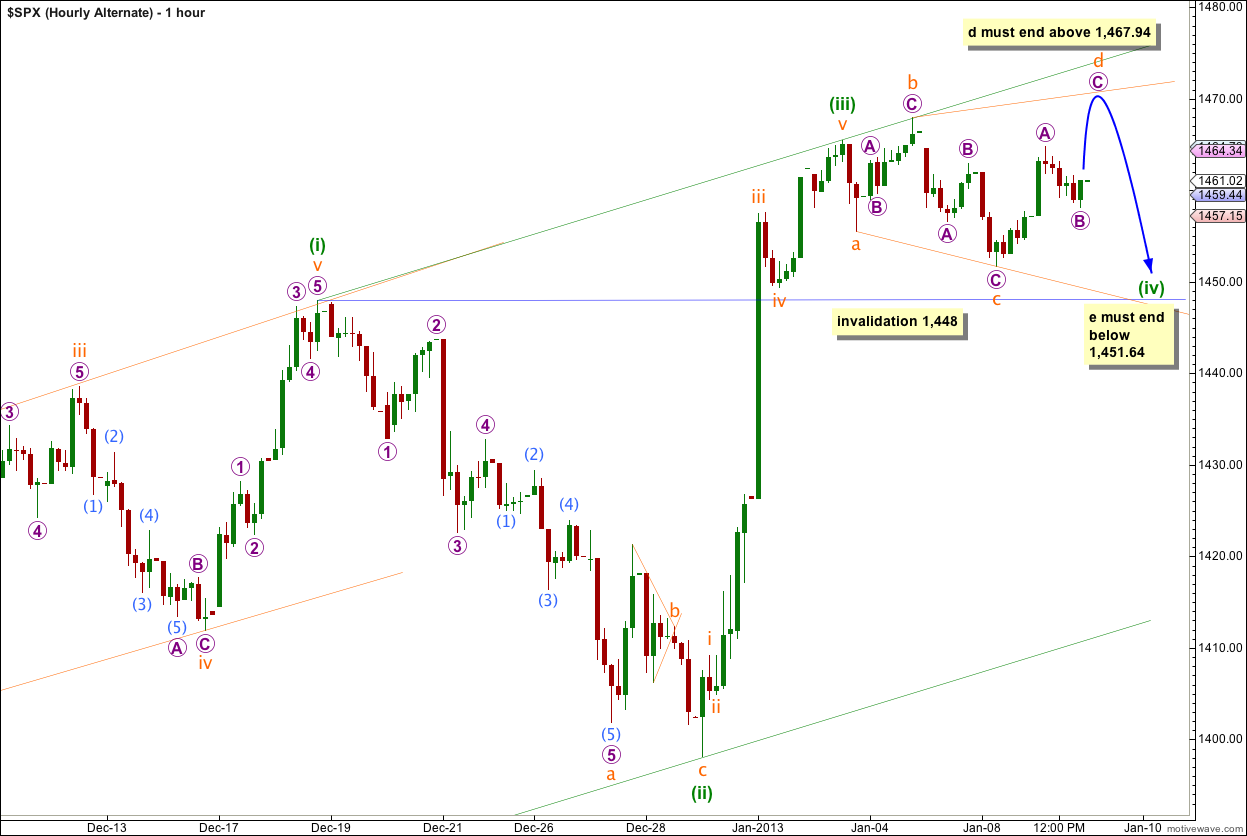
I have considered several possibilities and discarded them due to not complying with rules, or having a completely wrong look. This alternate remains because it meets all rules and has a good look.
It is entirely possible that wave (iv) green may yet continue further sideways to take up more time and be more in proportion in terms of duration to wave (ii) green.
This alternate wave count has a low probability because expanding triangles are the rarest of all Elliott wave structures. However, it is technically viable so it may be considered if the main hourly wave count is invalidated.
Within an expanding triangle wave d orange must end beyond the end of wave b orange. This structure requires movement above 1,467.94 to a new high in the first instance. Thereafter, wave e orange must move beyond the end of wave c orange to a new low below 1,451.64.
Wave (iv) green may not move into wave (i) green price territory. This wave count is invalidated with movement below 1,448.
Lara,
You do fantastic work. Thank you so much for the detail and alternate scenarios. It is truly appreciated.
John A
Thanks John!