
Last analysis expected overall more sideways movement within a limited range for Tuesday’s session which is essentially what we have seen. I had expected the session to begin with a little upwards movement though, which did not happen.
The wave count remains the same. The triangle structure is invalidated and so now we have just the one hourly wave count today.
Click on the charts below to enlarge.
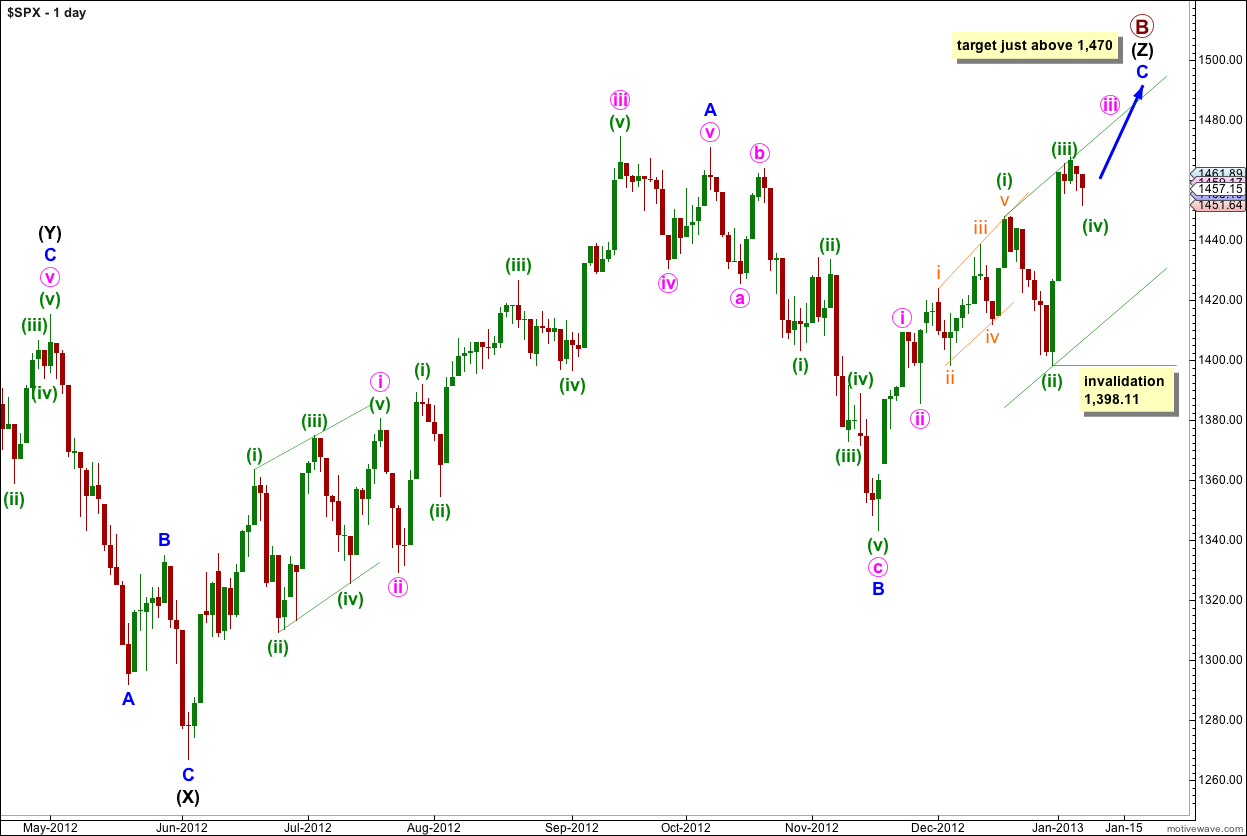
The structure for primary wave B is a triple zigzag, and price is now within the third zigzag in the triple labeled wave (Z) black.
Wave (Z) black is incomplete and is unfolding as an exaggerated zigzag.
Wave A blue must be truncated to subdivide into a five wave structure.
At 1,470 wave C blue would reach 0.618 the length of wave A blue. About this point primary wave B would also be only 139% of primary wave A. Movement to slightly above 1,470 would avoid a truncation and keep the length of primary wave B closer to the common maximum of 138%.
There is no upper invalidation point for this wave count, but significant movement above 1,470 has a low probability.
Wave A blue lasted 87 days (2 short of a Fibonacci 89). Wave B blue lasted 28 days. I would expect wave C blue to be about 34 days in duration. So far it has lasted 34 days and at this stage I am expecting it to possibly continue for another two to three weeks.
Wave C blue must subdivide into a five wave structure as either an ending diagonal or an impulse. An ending diagonal requires all subwaves to subdivide as zigzags and because the first wave upwards labeled i pink is a five wave impulse an ending diagonal may be eliminated. Wave C blue must be unfolding as an impulse. The structure is incomplete and requires further upwards movement.
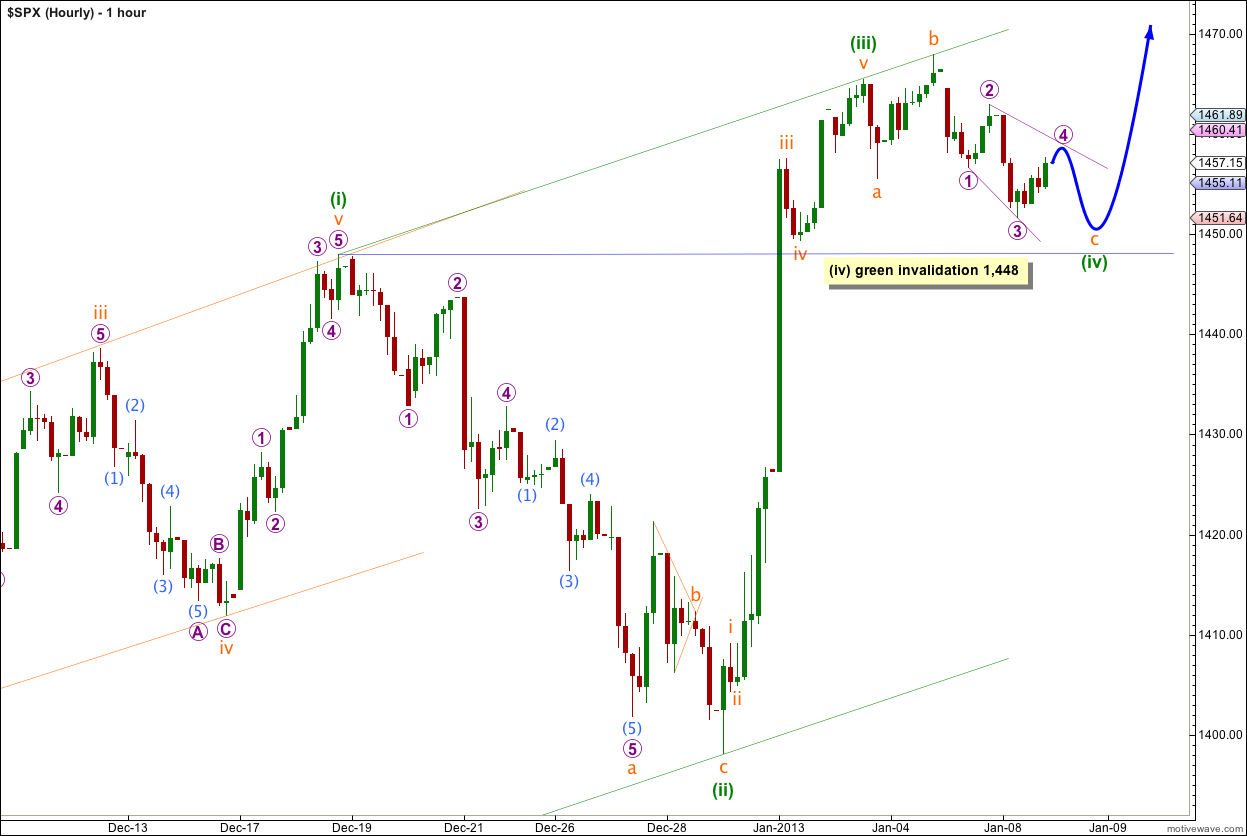
Wave (iv) green cannot be a triangle or a zigzag and so may be unfolding as a flat correction. So far waves a and b orange are complete, and wave c orange requires a little more downwards movement.
Because wave b orange was a 125% correction of wave a orange this would be an expanded flat.
There are two structural possibilities for wave c orange: either an impulse or an ending diagonal. Because wave 4 purple has overlapped wave 1 purple price territory we can eliminate an impulse. On the 5 minute chart it is possible to see all the subwaves of this diagonal dividing into zigzags which is a requirement for an ending diagonal. Wave 4 purple is an incomplete zigzag and requires further upwards movement. The diagonal is expanding and wave 4 purple should be longer than wave 2 purple above 1,458.
Wave 4 purple may not move beyond the end of wave 2 purple. The diagonal structure for wave c orange is invalidated with movement above 1,462.97 (before it is completed).
Wave 5 purple may take price below the end of wave 3 purple to a new low below 1,451.64 to avoid a truncation and to be longer than wave 3 purple.
At 1,452 wave c orange would reach 1.618 the length of wave a orange. It may end a little below this point and still retain an adequate Fibonacci ratio.
Wave (iv) green may not move into wave (i) green price territory. This wave count is invalidated with movement below 1,448.
When this expanded flat structure is complete we will have two hourly wave counts; this one which would expect that wave (iv) green in its entirety is complete and an alternate which would look at the possibility that wave (iv) green may continue sideways for another week or so as a double flat or double combination.
Lara,
Your last video session, for the 8th January, was very blurred!
thanks Nick. yes, we have had some issues with the video provision and we will be looking at improving it today.
Looks like your old Expanding Triangle is coming back on the table for us again 1530.45++
I’m leaving that historic wave count as an outlying alternate. At this stage I have seen nothing to indicate a new all time high is likely, it has a very low probability.