
Yesterday’s analysis expected choppy, overlapping and sideways movement during Friday’s session. Price has moved slightly higher in slow moving movement which is entirely consistent with our wave count.
The wave count remains the same and I still have just the one daily and one hourly chart for you to end the week.
Click on the charts below to enlarge.
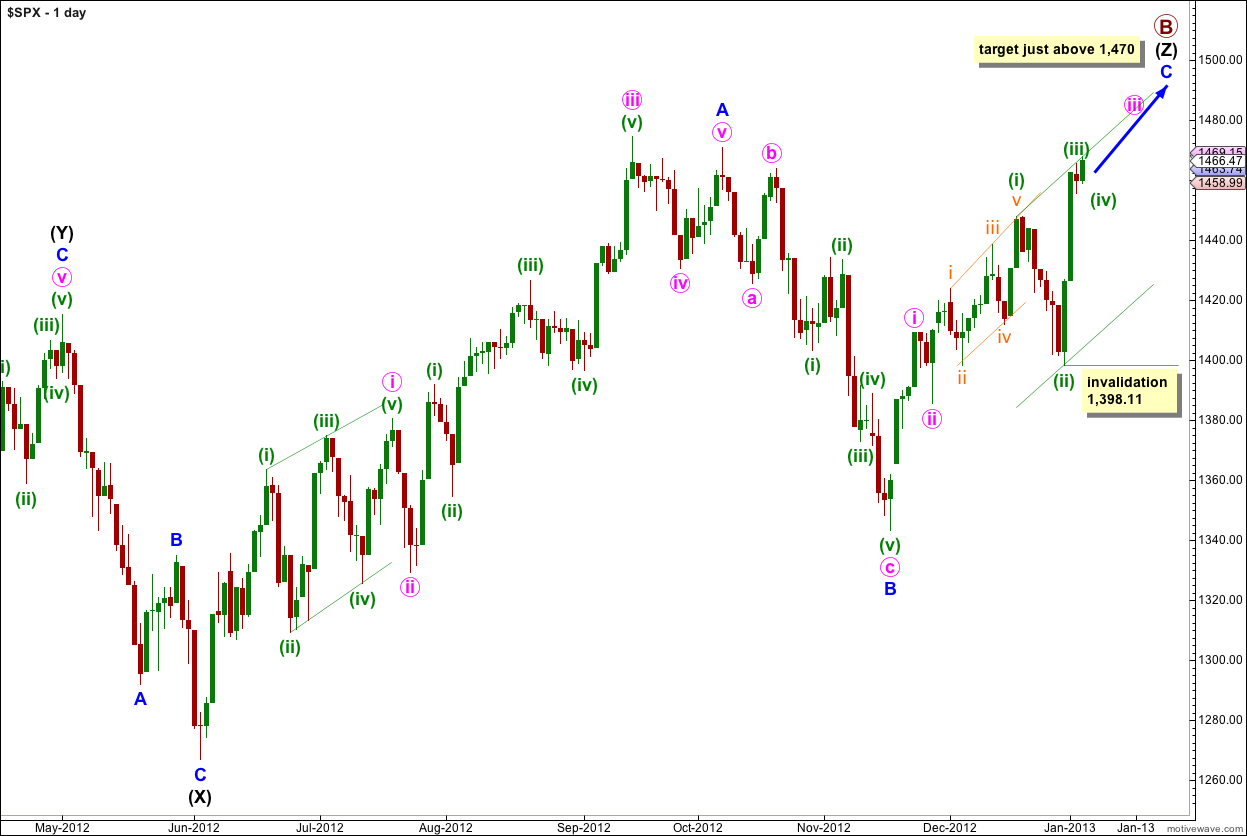
The structure for primary wave B is a triple zigzag, and price is now within the third zigzag in the triple labeled wave (Z) black.
Wave (Z) black is incomplete and is unfolding as an exaggerated zigzag.
Wave A blue must be truncated to subdivide into a five wave structure.
At 1,470 wave C blue would reach 0.618 the length of wave A blue. About this point primary wave B would also be only 139% of primary wave A. Movement to slightly above 1,470 would avoid a truncation and keep the length of primary wave B closer to the common maximum of 138%.
There is no upper invalidation point for this wave count, but significant movement above 1,470 has a low probability.
Wave A blue lasted 87 days (2 short of a Fibonacci 89). Wave B blue lasted 28 days. I would expect wave C blue to be about 34 days in duration. So far it has lasted 32 days and at this stage I am expecting it to possibly continue for another two to three weeks.
Wave C blue must subdivide into a five wave structure as either an ending diagonal or an impulse. An ending diagonal requires all subwaves to subdivide as zigzags and because the first wave upwards labeled i pink is a five wave impulse an ending diagonal may be eliminated. Wave C blue must be unfolding as an impulse. The structure is incomplete and requires further upwards movement.
Recent upwards movement from the low labeled wave B blue at 1,343.35 looks like a smaller fractal of the upwards movement from the low labeled wave (X) black.
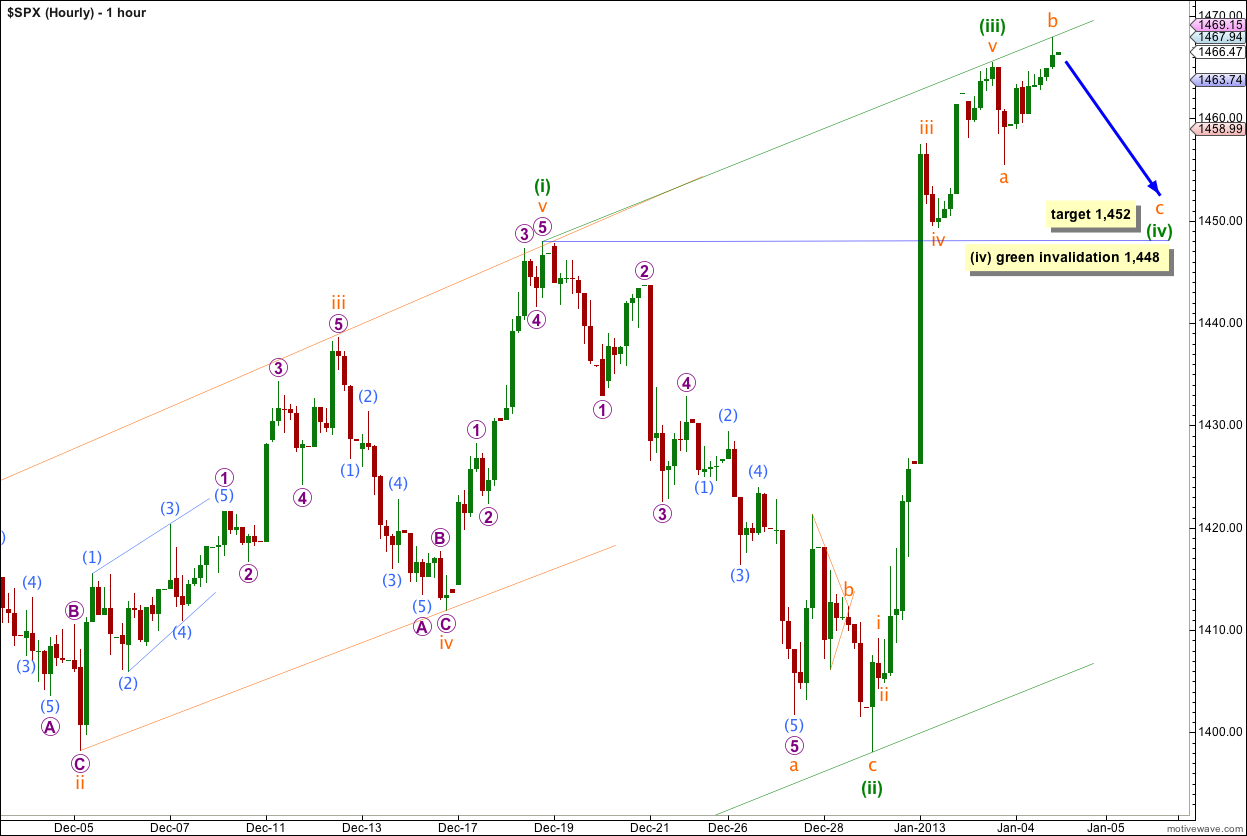
Price moved slightly higher in slow movement. This is probably wave b orange within wave (iv) green which may be unfolding as a flat correction.
The most common type of flat is an expanded flat which requires the b wave to make a new price extreme beyond the start of the a wave, so a new high is entirely consistent with this wave count.
On the five minute chart the structure of wave b orange subdivides nicely into a zigzag and may be over, or the fifth wave within it may yet extend a little higher.
If wave b orange is over here then at 1,452 wave c orange would reach 1.618 the length of wave a orange.
If wave b orange extends a little higher then movement above 1,469 has a low probability. At this point wave b orange would reach the maximum common length of 138% the length of wave a orange.
From the five minute chart movement below 1,459.6 would indicate that wave b orange was complete and wave c orange downwards should be underway.
When wave c orange is complete then wave (iv) green in its entirety may be complete. Alternatively, if we move the degree of labeling within wave (iv) green all down one degree then the first flat in a double may be complete.
Wave (ii) green lasted 8 sessions. So far wave (iv) green has lasted only one session. It may continue about another week, so a double flat or double combination will be entirely possible.
Wave (iv) green may not move into wave (i) green price territory. This wave count is invalidated with movement below 1,448.
If the invalidation point is breached in the next few sessions it will indicate that wave (iii) green may not be over. Downwards movement may be a correction within wave (iii) green.
cool … thank you
oops wrong link … http://charts.stocktwits.net/production/original_11306266.png?1357530911 this one… you can delete the other one
Yep. All wrong.
Within doubles (and triples) subwaves W, X, Y (and Z) can only subdivide into zigzags, triangles, or flats. They cannot themselves subdivide into doubles (or triples).
The maximum number of corrective structures in a multiple is three.
“Elliott Wave Principle” by Frost and Prechter, 10th edition, page 91.
Please tell me this one http://charts.stocktwits.net/production/original_11306148.png?1357529543 is all wrong too.