
Analysis of the S&P 500 for the session dated 2nd January expected price to move higher at the beginning of Thursday’s session to a short term target at 1,467. Price fell just 1.53 points short of this target before turning lower.
The wave count is the same with just one daily and one hourly chart.
Click on the charts below to enlarge.
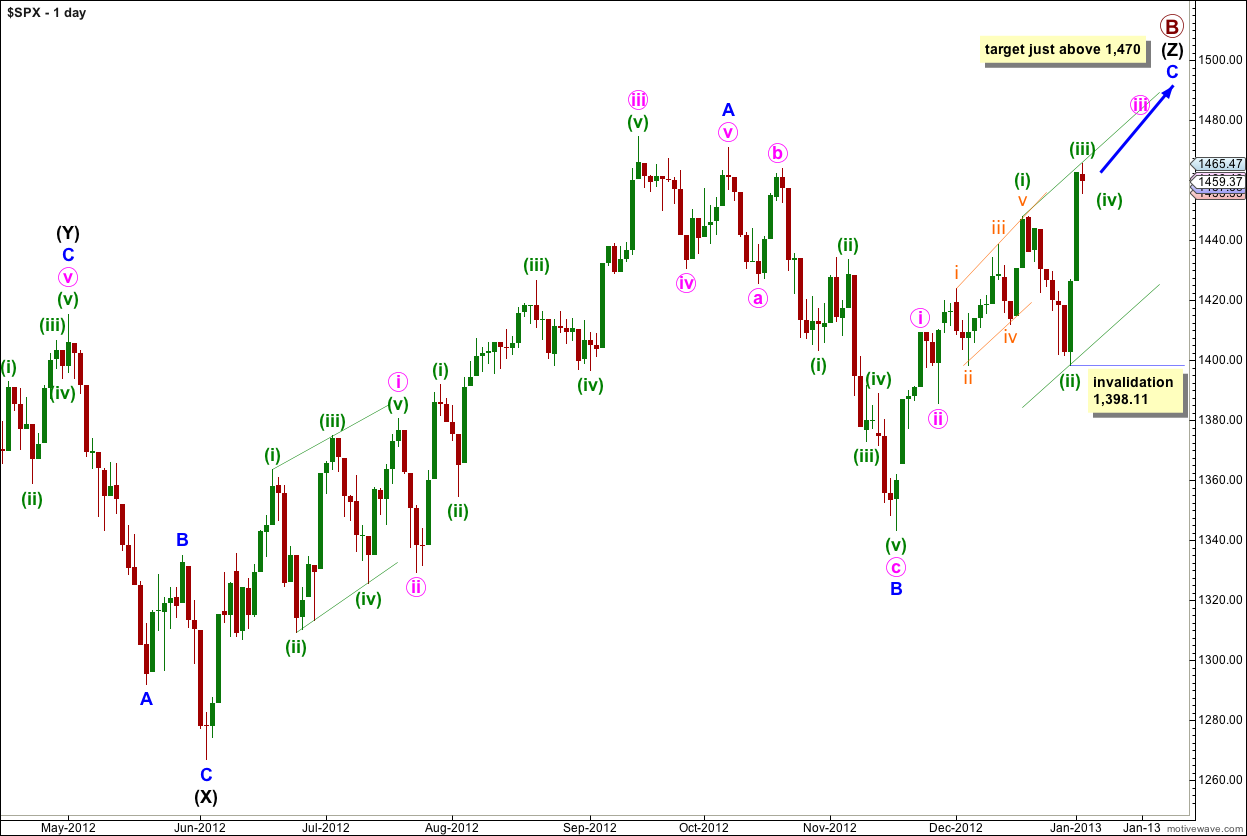
The structure for primary wave B is a triple zigzag, and price is now within the third zigzag in the triple labeled wave (Z) black.
Wave (Z) black is incomplete and is unfolding as an exaggerated zigzag.
Wave A blue must be truncated to subdivide into a five wave structure.
At 1,470 wave C blue would reach 0.618 the length of wave A blue. About this point primary wave B would also be only 139% of primary wave A. Movement to slightly above 1,470 would avoid a truncation and keep the length of primary wave B closer to the common maximum of 138%.
There is no upper invalidation point for this wave count, but significant movement above 1,470 has a low probability.
Wave A blue lasted 87 days (2 short of a Fibonacci 89). Wave B blue lasted 28 days. I would expect wave C blue to be about 34 days in duration. So far it has lasted 31 days and at this stage I am expecting it to possibly continue for another two to three weeks.
Wave C blue must subdivide into a five wave structure as either an ending diagonal or an impulse. An ending diagonal requires all subwaves to subdivide as zigzags and because the first wave upwards labeled i pink is a five wave impulse an ending diagonal may be eliminated. Wave C blue must be unfolding as an impulse. The structure is incomplete and requires further upwards movement.
Recent upwards movement from the low labeled wave B blue at 1,343.35 looks like a smaller fractal of the upwards movement from the low labeled wave (X) black.
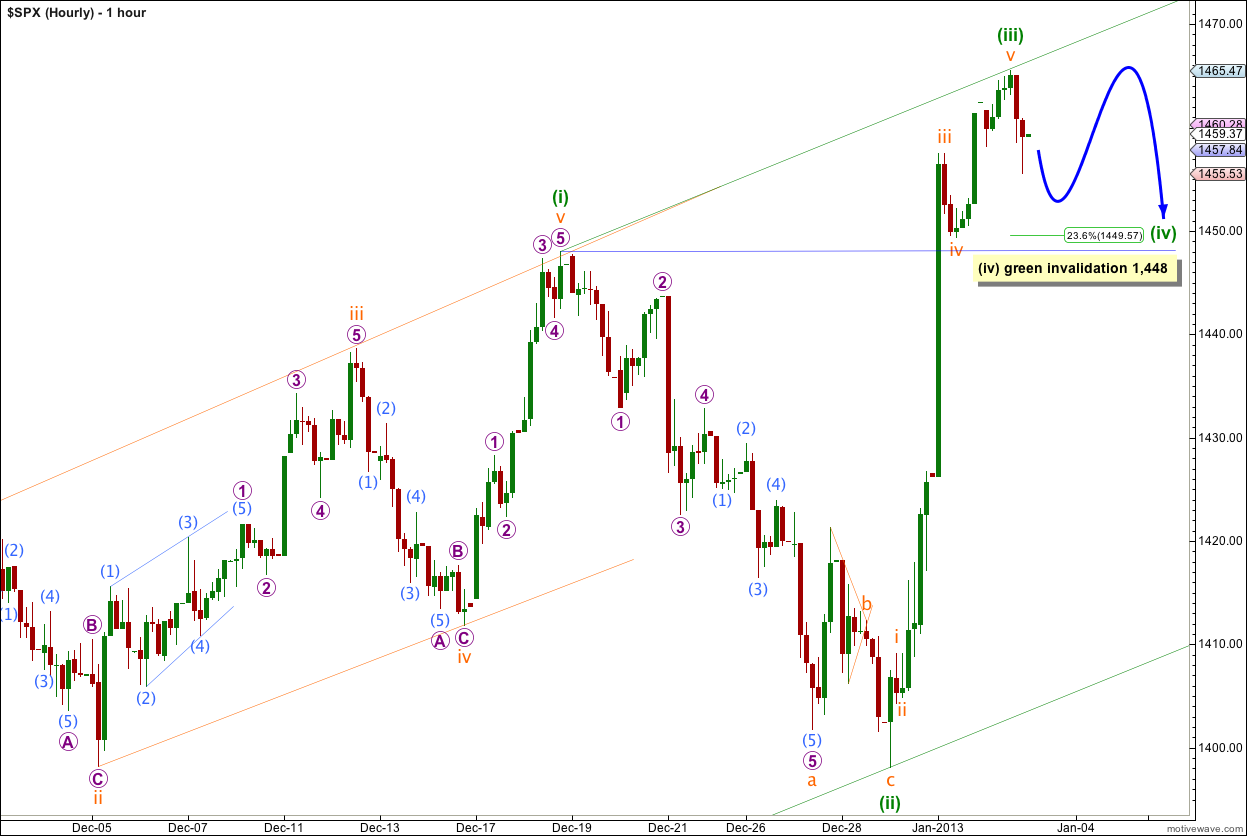
It looks likely that wave (iii) green is complete. Wave (iii) green was just 4.79 points longer than equality with wave (i) green.
Within wave (iii) green are there are no adequate Fibonacci ratios between orange waves i, iii and v.
Wave (ii) green was a deep 80% correction and a zigzag structure lasting a Fibonacci 8 days. We may expect wave (iv) green to be very shallow, about 0.236 of wave (iii) green at 1,449.57, and to be a sideways structure such as a flat, triangle or double combination, lasting 8 or 13 days.
Wave (iv) green may not move into wave (i) green price territory. This wave count is invalidated with movement below 1,448.
If the invalidation point is breached in the next few sessions it will indicate that wave (iii) green may not be over. Downwards movement may be a correction within wave (iii) green.
OK … Thank you.
I’m sorry for the slow reply. I was moving house over the last two days.
How high would Wave (iii) pink take us if 1448 holds.
I will calculate that when wave (iv) green is over. I cannot do that yet.
Pink wave degree gives a target i pink X 1.618 iii pink = 1,492 which is too high so I need to use green wave degree.