
Last analysis expected downwards movement for the last session of the year. Price did make a new low but turned to move strongly upwards for the session breaching the short term invalidation point on the hourly charts.
The wave counts remain the same, with the main wave count and the alternate having about an even probability. We may use the confirmation / invalidation point to show us which wave count is correct.
Click on the charts below to enlarge.
Main Wave Count.
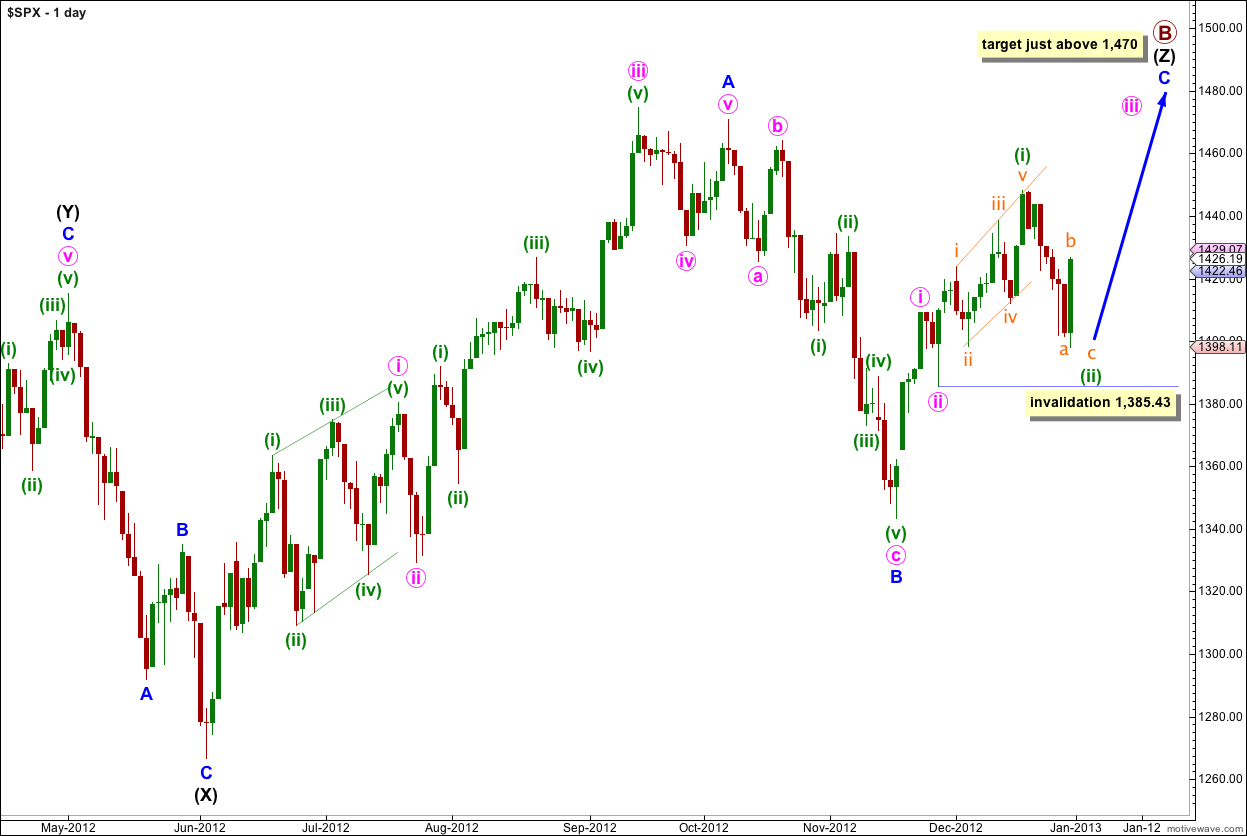
The structure for primary wave B is a triple zigzag, and price is now within the third zigzag in the triple labeled wave (Z) black.
Wave (Z) black is incomplete and is unfolding as an exaggerated zigzag.
Wave A blue must be truncated to subdivide into a five wave structure.
At 1,470 wave C blue would reach 0.618 the length of wave A blue. About this point primary wave B would also be only 139% of primary wave A. Movement to slightly above 1,470 would avoid a truncation and keep the length of primary wave B closer to the common maximum of 138%.
There is no upper invalidation point for this wave count, but significant movement above 1,470 has a low probability.
Wave A blue lasted 87 days (2 short of a Fibonacci 89). Wave B blue lasted 28 days. I would expect wave C blue to be about 34 days in duration. So far it has lasted 30 days and it should continue for another week or so.
Wave C blue must subdivide into a five wave structure as either an ending diagonal or an impulse. An ending diagonal requires all subwaves to subdivide as zigzags and because the first wave upwards labeled i pink is a five wave impulse an ending diagonal may be eliminated. Wave C blue must be unfolding as an impulse. The structure is incomplete and requires further upwards movement.
Recent upwards movement from the low labeled wave B blue at 1,343.35 looks like a smaller fractal of the upwards movement from the low labeled wave (X) black.
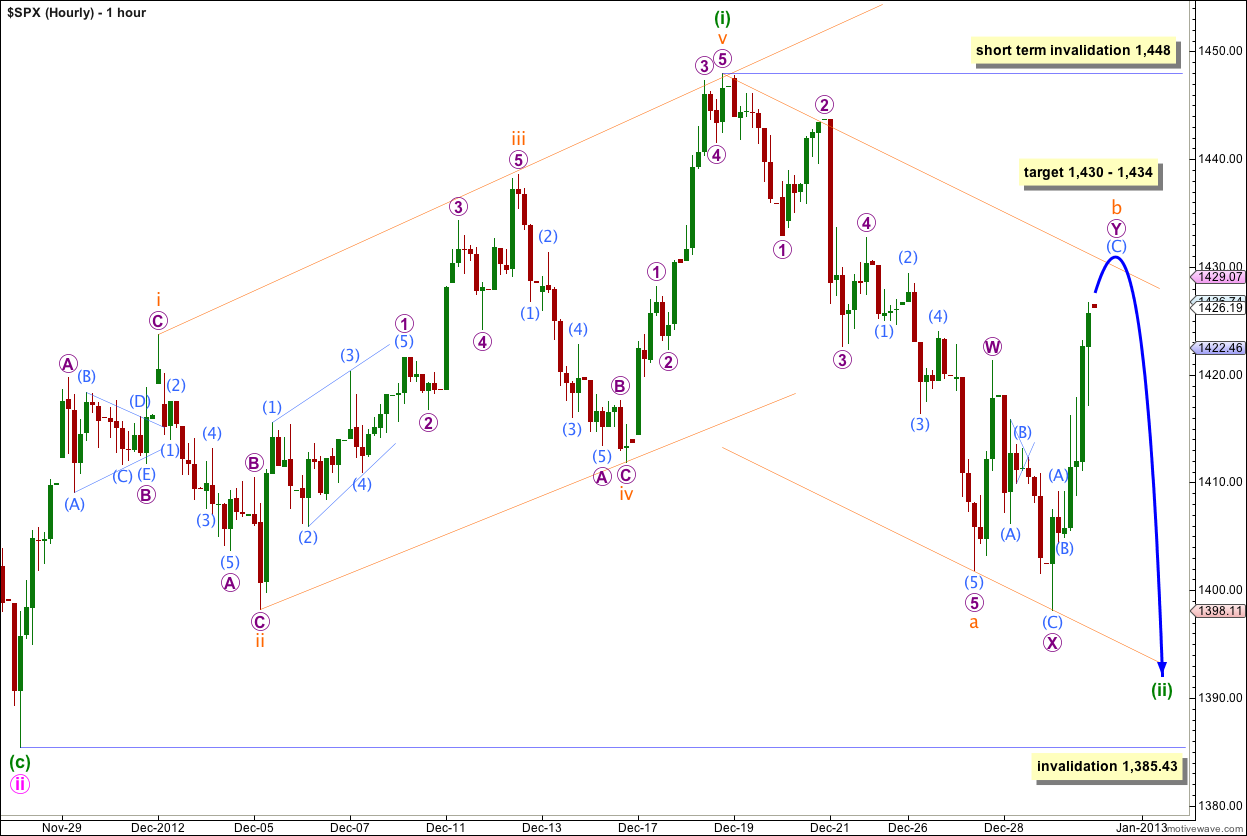
Wave (ii) green is unfolding as a zigzag and wave b orange within it extended further during last session.
Wave b orange has continued further as a double zigzag correction, although it looks like and is behaving like an expanded flat. It is a double zigzag because on the five minute chart the movement labeled wave (B) aqua within wave Y purple looks very much like a triangle and so is extremely unlikely to be a second wave. This means the upwards movement labeled wave Y purple is a zigzag and not a five wave structure, which it would be for a C wave of an expanded flat.
At 1,434 wave (C) aqua within wave Y purple would reach 2.618 the length of wave (A) aqua. At 1,430 wave Y purple would reach 1.618 the length of wave W purple. I favour the upper end of this small target zone.
It is also possible that wave b orange is an expanded flat and the upwards movement of wave Y purple is a C wave to end it. If this is the case then upwards movement would still be required to complete a five wave structure.
When a little more upwards movement completes wave b orange redraw the parallel channel about wave (ii) green. Draw the first trend line from the start of wave a orange to the end of wave b orange then place a parallel copy upon the end of wave a orange. Expect wave c orange downwards to make a new low below the end of wave a orange to avoid a truncation and to find support at the lower edge of the channel.
Wave c orange to complete wave (ii) green may not move beyond the start of wave (i) green. This wave count is invalidated with movement below 1,385.43.
If this wave count is invalidated with downwards movement then we may use the alternate below.
Alternate Wave Count.
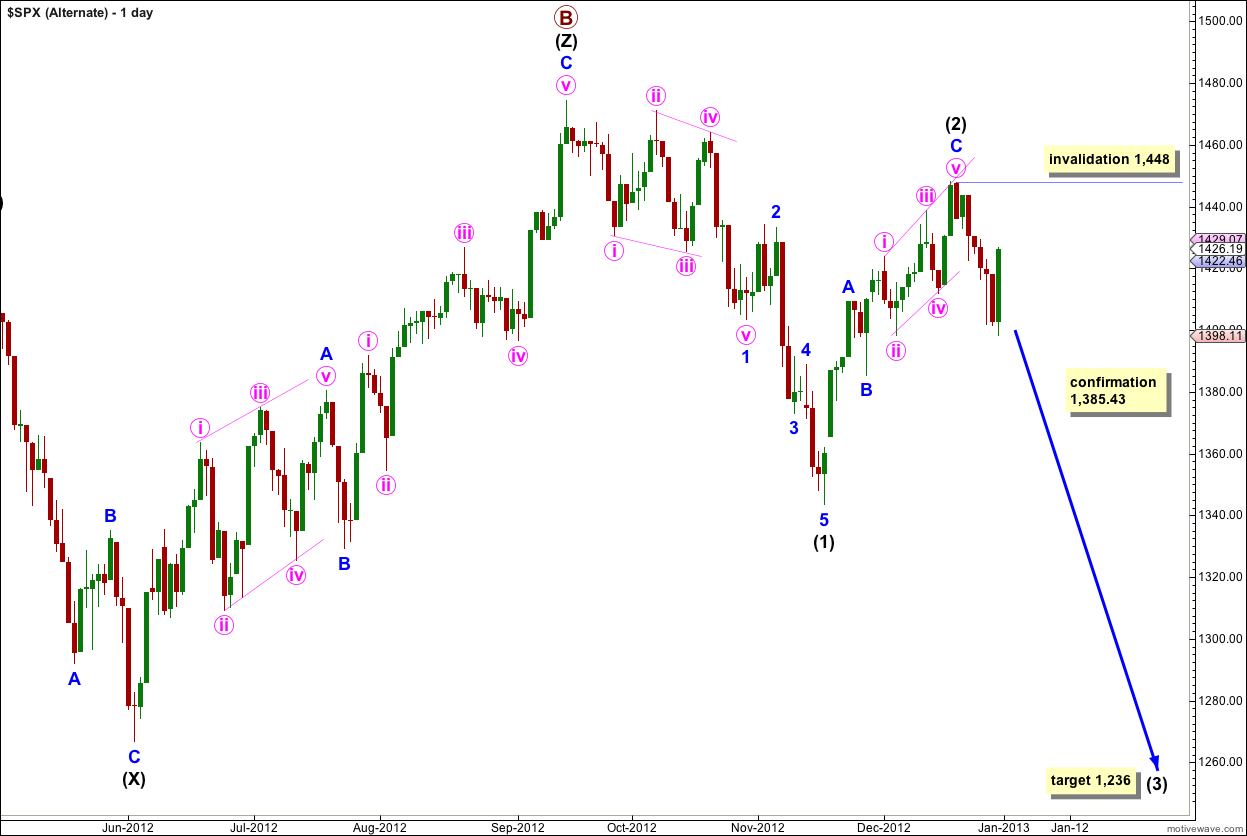
While price is below 1,474.51 it is still possible that primary wave B is a complete triple zigzag and downwards movement is the start of primary wave C.
Downwards movement from the high is difficult to see as an impulse and it cannot be a leading diagonal. The problem is the first series of overlapping waves labeled wave 1 blue. I have labeled this as a leading diagonal and each subwave subdivides correctly, but the wave lengths are not as expected. The structure is neither an expanding or contracting diagonal, wave iv pink is shorter than wave ii pink, but wave iii pink is longer than wave i pink and wave v pink is longer than wave iii pink.
This reduces the probability that this wave count is correct, but it does suffer from the same problem now as the main wave count (although to a slightly greater degree).
Upwards movement from the low of wave (1) black subdivides nicely into a zigzag and so may be a completed second wave correction for wave (2) black which is an 80% correction of wave (1) black. Wave C blue is just 3.24 points short of equality with wave A blue.
Within wave (2) black wave C blue subdivides into an ending diagonal and it is possible on the hourly chart (and the five minute chart) to see all the subwaves of this ending diagonal as zigzags.
If this alternate is correct then we may expect movement below 1,385.43 to confirm it within the next two weeks.
Wave (3) black will reach 1.618 the length of wave (1) black at 1,236.
Within wave (3) black no second wave correction may move beyond the start of its first wave. This wave count is invalidated with movement above 1,448.
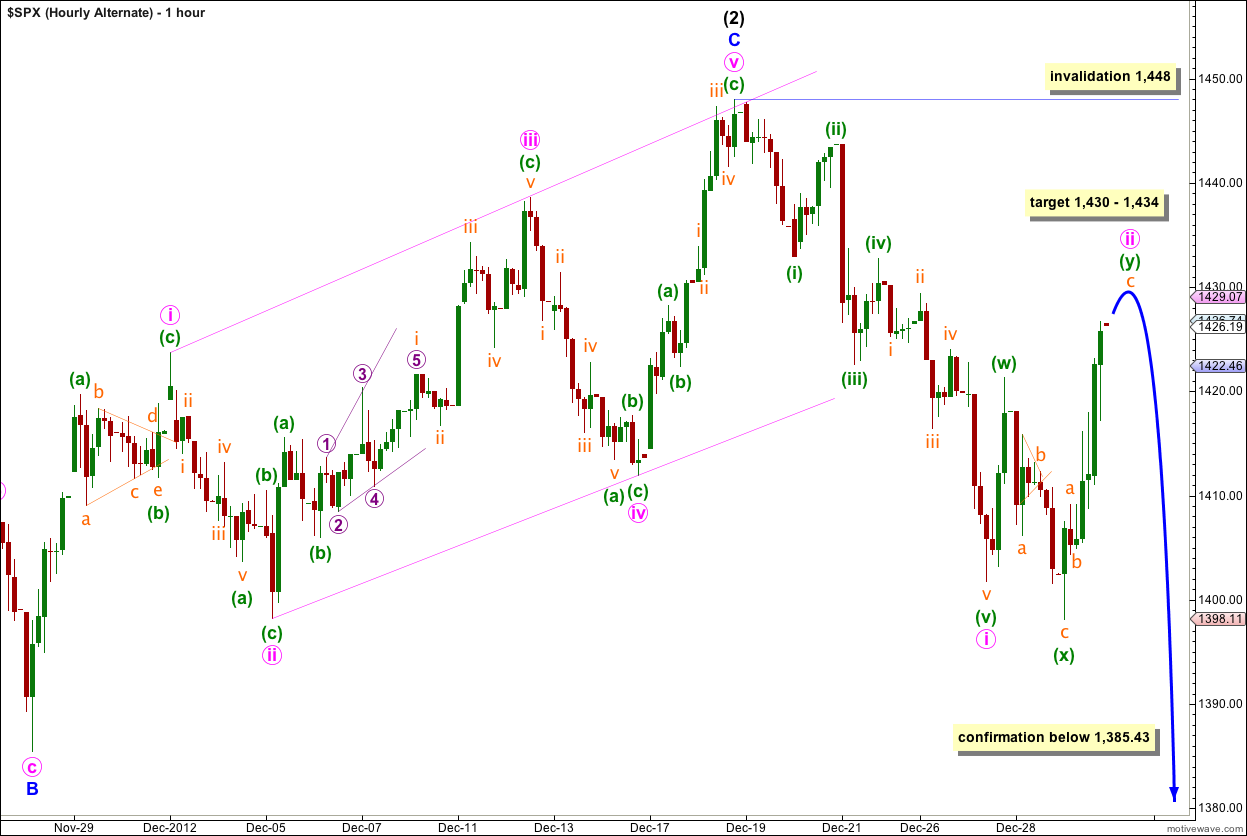
Subdivisions of recent movement from the high here labeled wave (2) black at 1,448 are the same as for the main hourly wave count, except downwards movement here is a first wave instead of an A wave, and upwards movement is a second wave instead of a B wave. 1-2 and A-B have the same subdivisions.
Wave ii pink is either a double zigzag (most likely) or an expanded flat correction. Either way it requires a little more upwards movement.
Wave ii pink may not move beyond the start of wave i pink. This wave count is invalidated with movement above 1,448.
When we know where wave ii pink has ended then we may calculate a target downwards for wave iii pink. We should be able to do this after one more session.
Wave iii pink downwards should increase in momentum and take price below the confirmation point at 1,385.43 within one to three sessions if this wave count is correct.
Lara, nice job
Thanks.
I’m annoyed with myself for being distracted and coming up with that alternate. I almost had this one right and if I’d kept with the main wave count and the triangle for wave b orange I could have predicted this strong third wave up for you.
I’ll learn from this and hope to do better next time.
From my view you had it spotted correctly and only got distracted in the end. The nature of this unrelenting low volume beast is to do exactly that over and over. I’m just happy to stay out until this final five up completes. Expect major change after that – volume is overall key to break the market maker control IMO. When that happens look out.
With movement above the short term invalidation point on the main wave count the third wave up is confirmed. A quick calculation gives a target at 1,467
SPX 1457.53 new high but no new high on the NYMO http://scharts.co/ZBsKSh
Trading 101: Sell the News