
Price has moved lower but remains above the lower invalidation point.
As stated in yesterday’s email to members, I expect that the leading diagonal structure is complete and this movement may be a correction.
The daily chart is mostly the same, and I have a new alternate for you.
Click on the charts below to enlarge.
Main Wave Count.
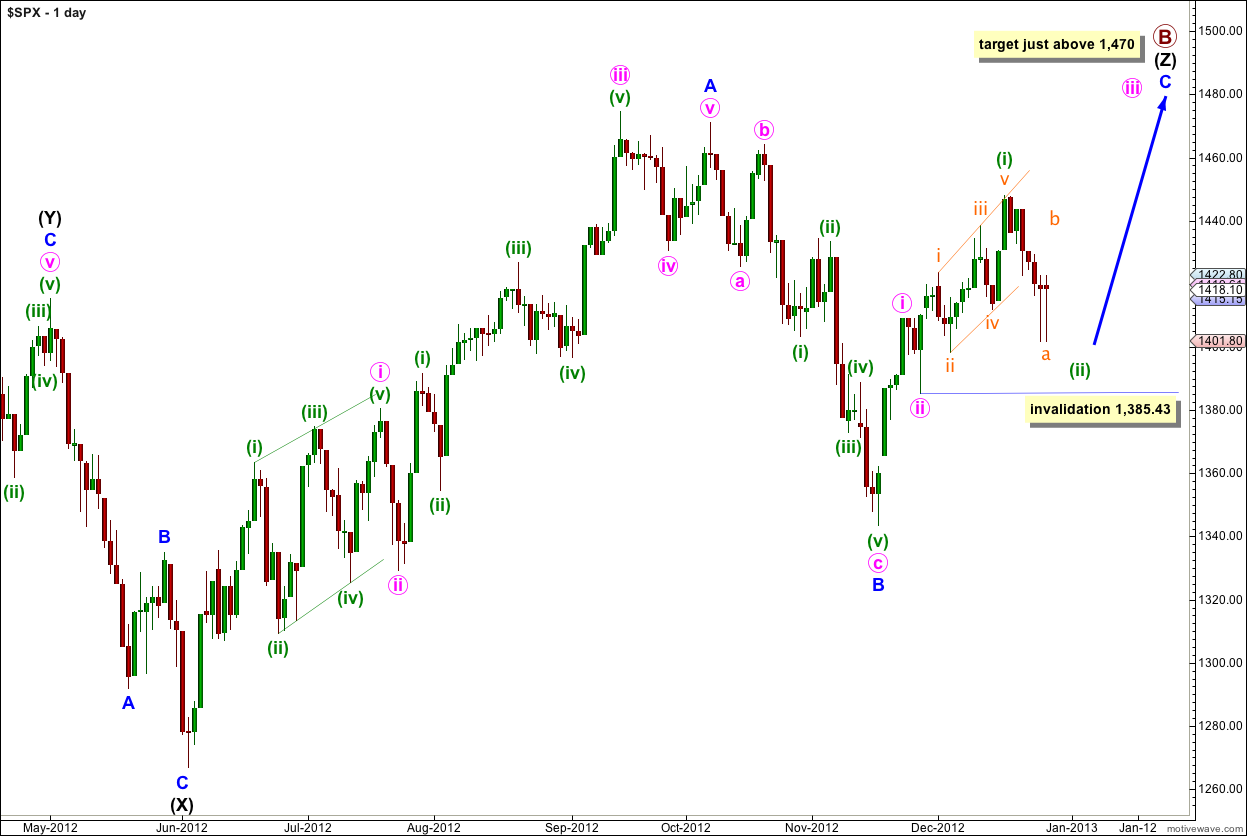
The structure for primary wave B is a triple zigzag, and price is now within the third zigzag in the triple labeled wave (Z) black.
Wave (Z) black is incomplete and is unfolding as an exaggerated zigzag.
Wave A blue must be truncated to subdivide into a five wave structure.
At 1,470 wave C blue would reach 0.618 the length of wave A blue. About this point primary wave B would also be only 139% of primary wave A. Movement to slightly above 1,470 would avoid a truncation and keep the length of primary wave B closer to the common maximum of 138%.
There is no upper invalidation point for this wave count, but significant movement above 1,470 has a low probability.
Wave A blue lasted 87 days (2 short of a Fibonacci 89). Wave B blue lasted 28 days. I would expect wave C blue to be about 34 days in duration. So far it has lasted 28 days and it should continue for another one to two weeks.
Wave C blue must subdivide into a five wave structure as either an ending diagonal or an impulse. An ending diagonal requires all subwaves to subdivide as zigzags and because the first wave upwards labeled i pink is a five wave impulse an ending diagonal may be eliminated. Wave C blue must be unfolding as an impulse. The structure is incomplete and requires further upwards movement.
Recent upwards movement from the low labeled wave B blue at 1,343.35 looks like a smaller fractal of the upwards movement from the low labeled wave (X) black.
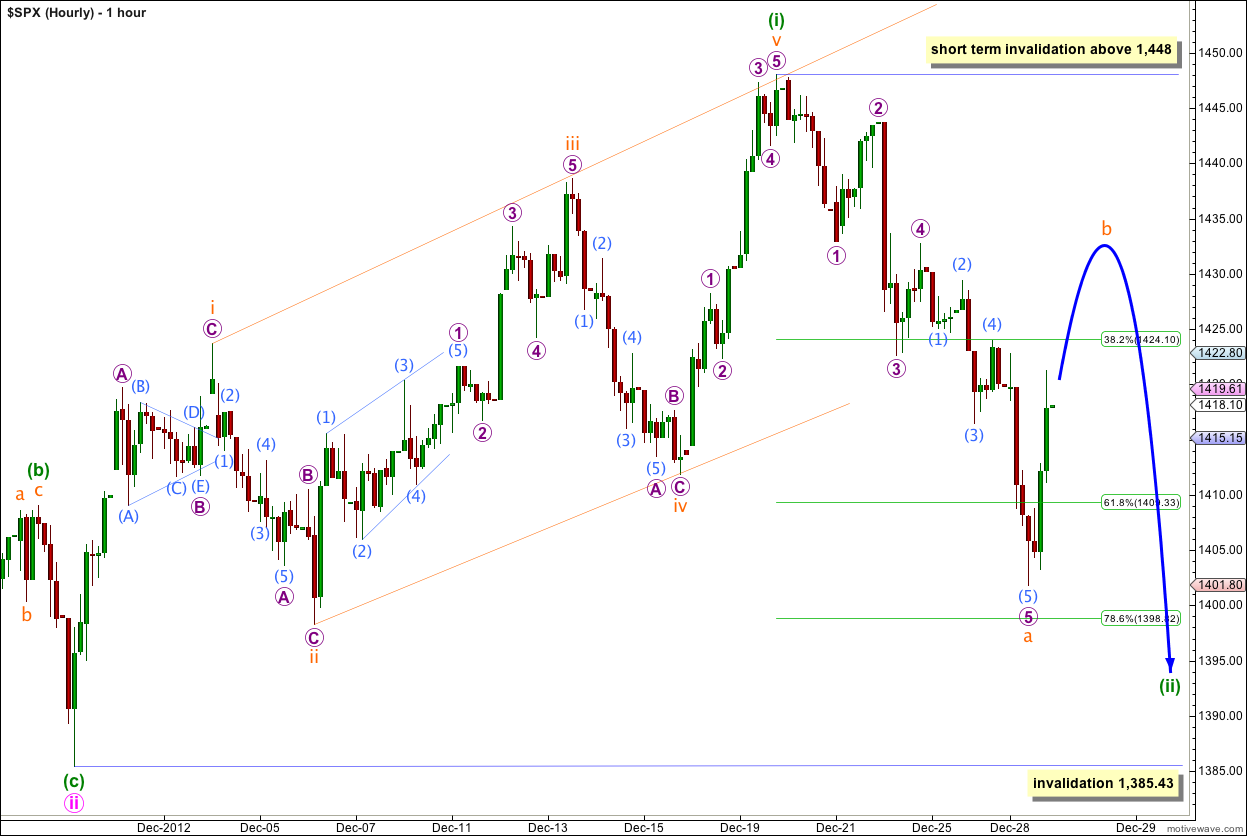
The leading diagonal structure for wave (i) green can be seen as complete. The diagonal is expanding: wave iii orange is longer than wave i orange and wave iv orange is longer than wave ii orange, but wave v orange is slightly shorter than wave i orange. The wave lengths are not what should be expected, but the third wave is not the shortest and the subdivisions are correct for a leading diagonal.
Downwards movement from the high at 1,448 so far subdivides into a five wave structure. This would be only wave a orange within wave (ii) green.
Wave b orange may not move beyond the start of wave a orange. This wave count is invalidated in the short term with movement above 1,448.
Following a leading diagonal in a first wave position the second wave is often very deep. I would expect wave (ii) green to end below 0.786 of wave (i) green, below 1,398. When we have the end of wave b orange then the ratio between waves a and c orange may be used to calculate a target for wave (ii) green to end.
Wave (i) green lasted 14 sessions. Wave (ii) green may be expected to last about one to two weeks; so far it has lasted only one week.
Wave (ii) green may not move beyond the start of wave (i) green. This wave count is invalidated with movement below 1,385.43. If it is invalidated with downwards movement we may use the alternate below.
Alternate Wave Count.
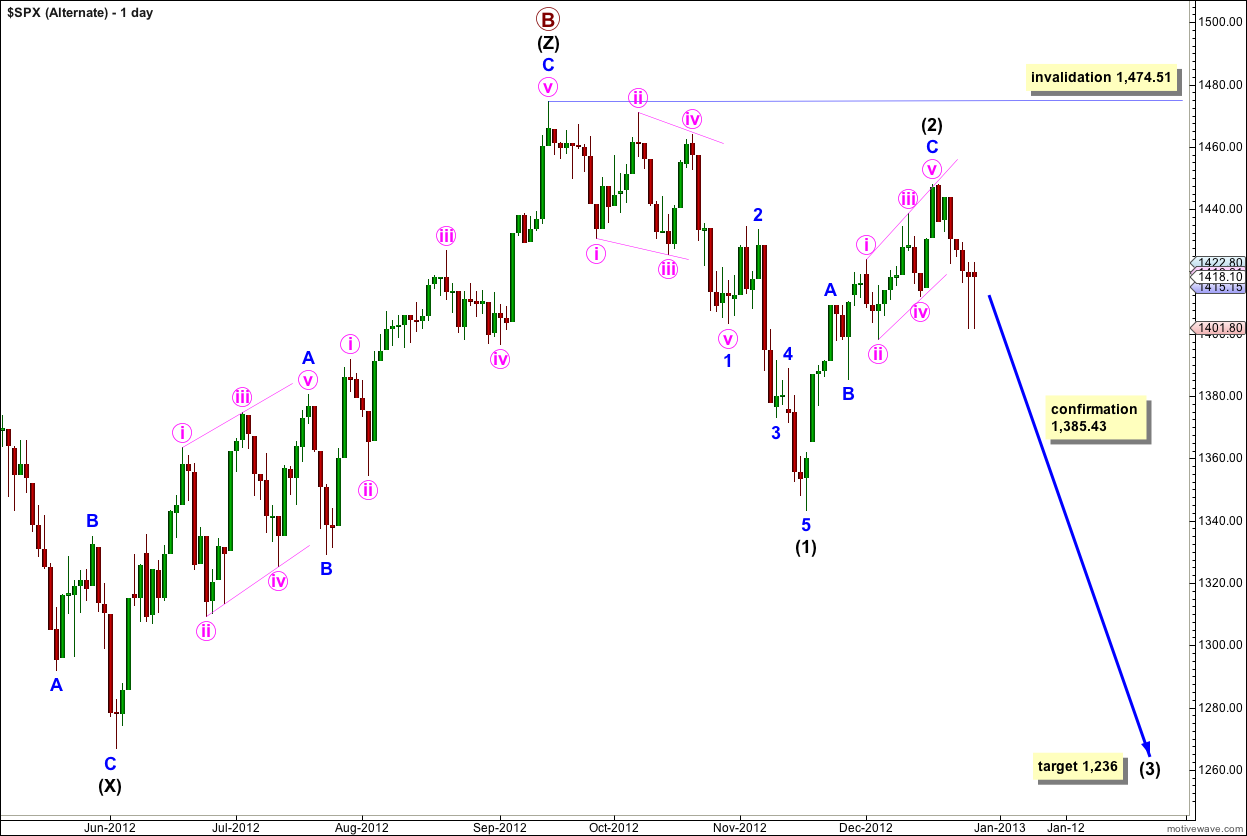
This wave count is the same as I have used previously up to the end of primary wave B at 1,474.51. It sees a trend change at primary degree at this point.
Downwards movement from the high is difficult to see as an impulse and it cannot be a leading diagonal. The problem is the first series of overlapping waves labeled wave 1 blue. I have labeled this as a leading diagonal; each subwave subdivides correctly but the wave lengths are not as expected. The structure is neither an expanding or contracting diagonal, wave iv pink is shorter than wave ii pink, but wave iii pink is longer than wave i pink and wave v pink is longer than wave iii pink.
This reduces the probability that this wave count is correct, but it does suffer from the same problem now as the main wave count (although to a greater degree).
The biggest problem with this wave count is the subdivisions of wave C blue within wave (2) black. All the subwaves of an ending diagonal must subdivide into zigzags, and within this structure subwaves iii and v pink look very much like five wave impulses on the hourly chart. This reduces the probability of this wave count significantly.
Upwards movement from the low of wave (1) black subdivides nicely into a zigzag and so may be a completed second wave correction for wave (2) black which is an 80% correction of wave (1) black. Wave C blue is just 3.24 points short of equality with wave A blue.
If this alternate is correct then we may expect movement below 1,385.43 to confirm it within the next two weeks.
Wave (3) black will reach 1.618 the length of wave (1) black at 1,236.
Lara,
What about relabeling the alternate wave 2 black so that A blue is what you now have as (i) pink, B blue is what you have as (ii) pink and C blue is three waves just completed and thus completing 2 black?
Thanks for your work and thanks also for your Christmas greeting card by email. That was very thoughtful.
Happy New Year,
Rodney
Yes, that certainly would have a better fit for the subdivisions on the hourly chart.
We would be expecting a third wave upwards for C blue.
In the short term it would still be the same; a b wave up followed by a c wave down to complete a low degree correction.
Yeah, the Christmas card seems to have been liked by members. It’s summer here, I love reggae and I live at the beach so it seemed appropriate 🙂
Nice … like the “Alternate Wave Count” shorted EOD yesterday /ES 1415.00 thinking about just staying short