
Last week’s analysis had two wave counts which diverged. With price movement above 13,290.75 the main wave count was invalidated and the alternate wave count was confirmed. At that point price was expected to move higher.
This week we have only one wave count which remains valid and has a typical look on the hourly chart.
Click on the charts below to enlarge.
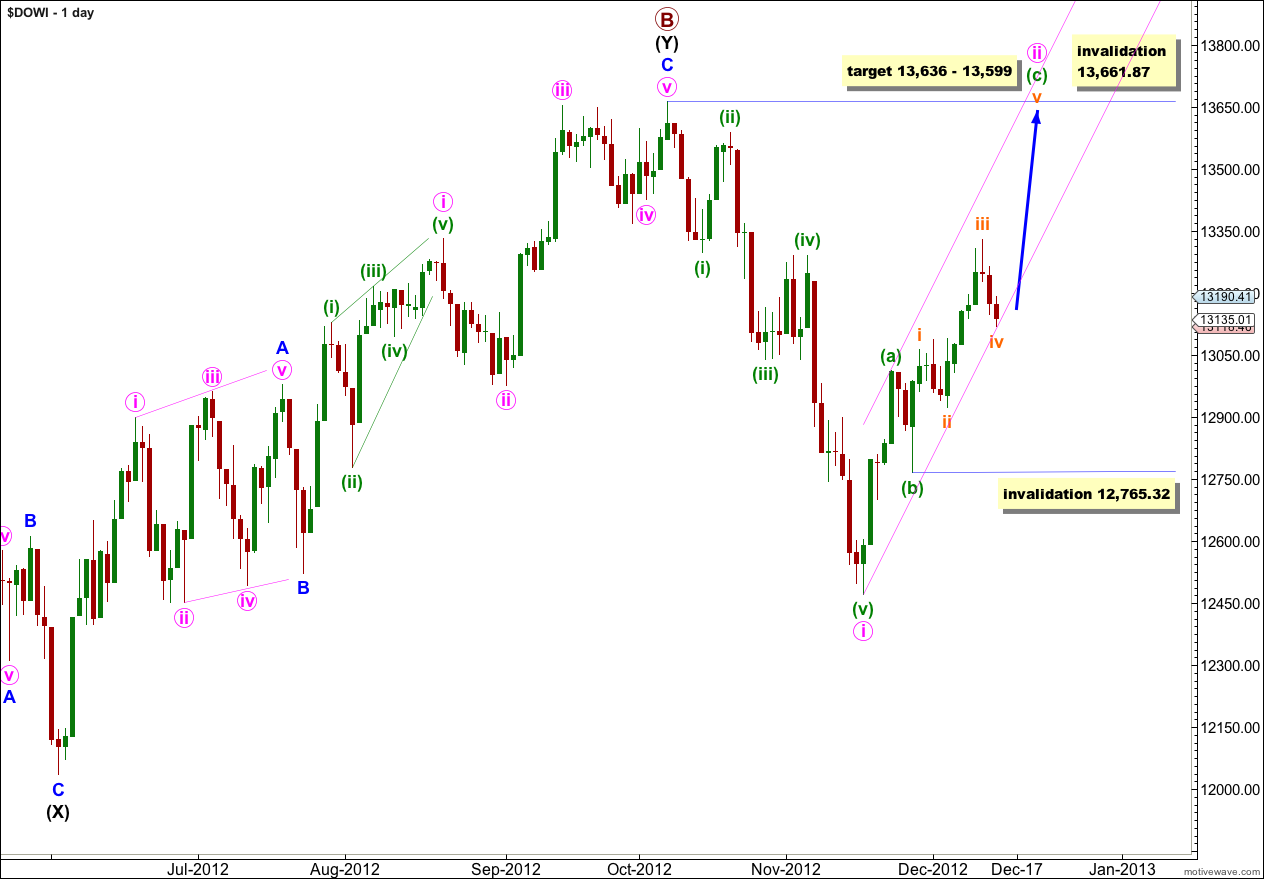
At the monthly chart level this wave count sees a common structure of a double flat unfolding at super cycle degree, and within the second flat primary waves A and B are complete. Primary wave B is a 139% correction of primary wave A.
Upwards movement may be wave ii pink.
Wave i pink lasted 28 days. So far wave ii pink would have lasted 19 days. We would expect it to continue higher and be longer in duration in order to be better in proportion to wave i pink. So far the structure within wave ii pink is incomplete and it requires more upwards movement.
Wave ii pink is most likely a zigzag because wave (a) green subdivides into a five.
At 13,636 wave (c) green would reach 1.618 the length of wave (a) green. At 13,599 wave v orange within wave (c) green would reach 1.618 the length of wave i orange.
Within wave ii pink wave (b) green may not move beyond the start of wave (a) green (if wave (b) green is not over and is continuing further as an expanded flat correction).
Within wave (c) green no second wave correction may move beyond the start of its first wave. This wave count is invalidated with movement above 12,765.32.
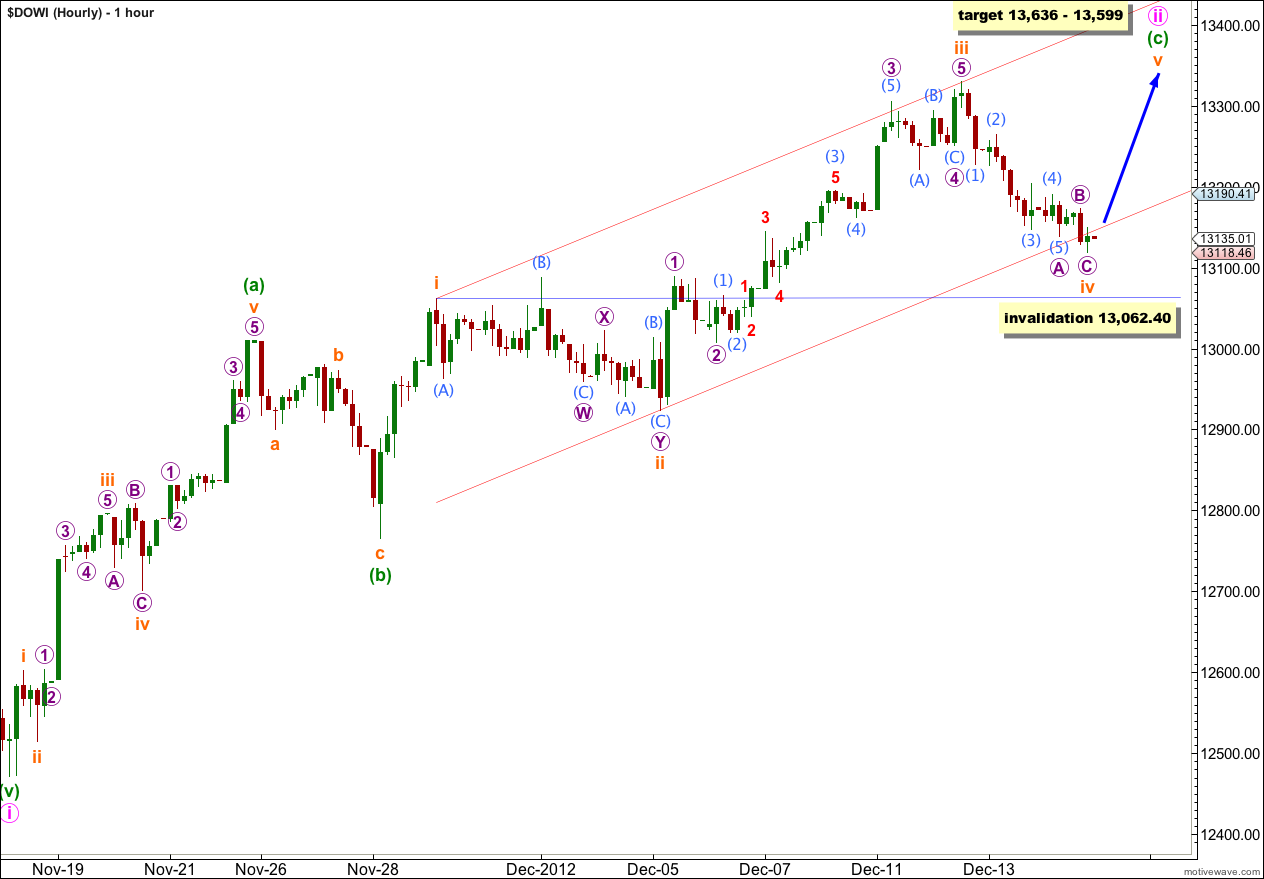
Within wave (c) green wave ii orange was a double combination correction and so far wave iv orange looks like a zigzag. Wave ii orange was a relatively shallow correction of wave i orange at 47%. So far wave iv orange is a relatively deep correction of wave iii orange at 52%.
If wave iv orange is over here, or very close by, then it has achieved perfect alternation with wave ii orange.
There is no Fibonacci ratio between waves iii and i orange. This makes it more likely that we shall see a Fibonacci ratio between wave v orange and either of i or iii.
The orange channel is drawn here using Elliott’s first technique: draw the first trend line from the highs of waves i to iii orange, then place a parallel copy upon the low of wave ii orange. So far wave iv orange has only just slightly overshot the channel. Wave v orange may end either mid way within the channel or about the upper edge.
Wave iv orange may not move into wave i orange price territory. This wave count is invalidated with movement below 13,062.40.
If this wave count is invalidated with downwards movement then it may be likely that the entire correction is over as a double zigzag. Movement below the invalidation point on the daily chart at 12,765.32 would provide confidence in a trend change.
Lara,
why wouldn’t you see your wave III orange as a wave II pink instead? Why does it have to be an expanded flat?