
Last analysis expected upwards movement during Thursday’s session which is not what has happened. Price moved lower to breach the invalidation point on the hourly chart requiring a reanalysis of recent movement.
The daily chart remains the same. The hourly chart is mostly the same.
Click on the charts below to enlarge.
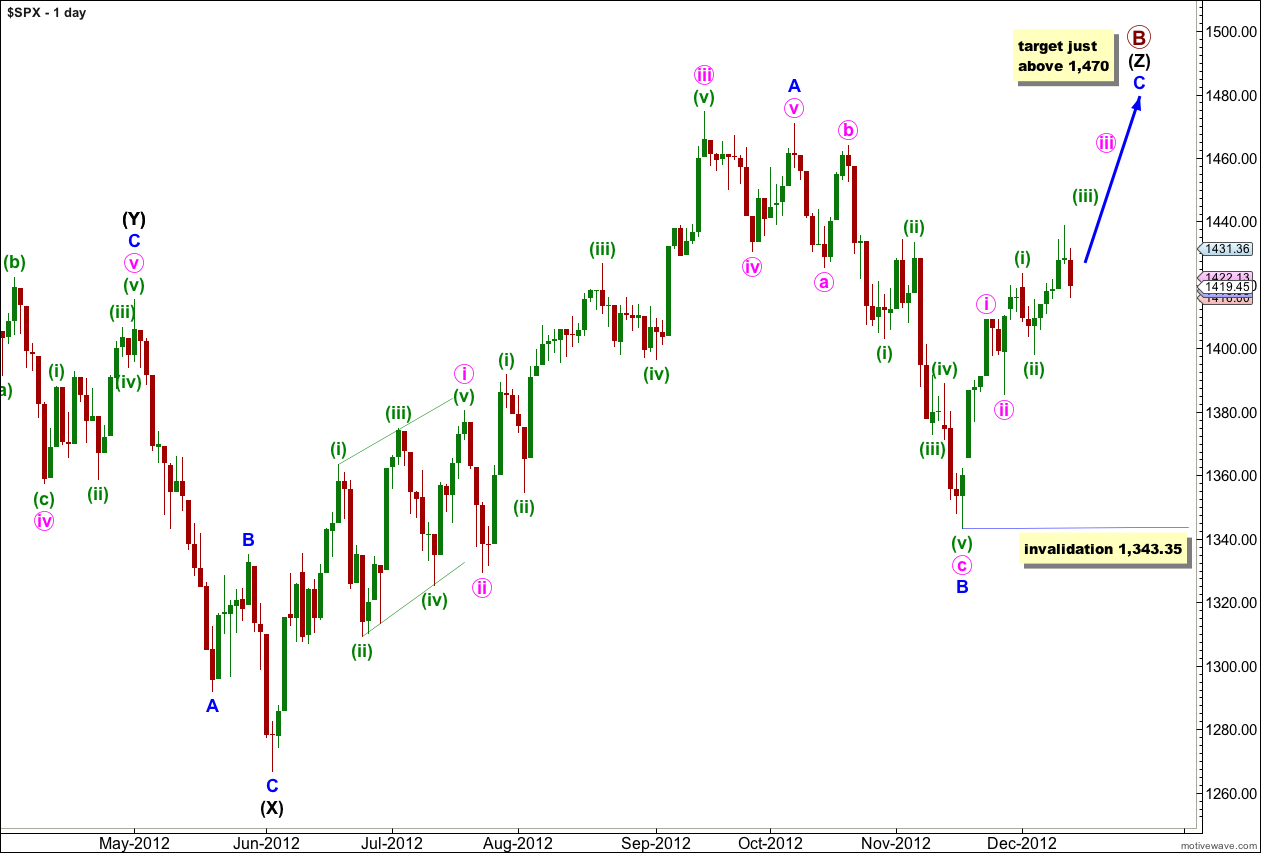
The structure for primary wave B is the same and this wave count is the same at the monthly chart level up to the start of wave (Z) black, the third zigzag in the triple.
Wave (Z) black may be incomplete and may be unfolding as a more exaggerated zigzag.
Wave A blue must be truncated to subdivide into a five wave structure.
At 1,470 wave C blue would reach 0.618 the length of wave A blue. About this point primary wave B would also be only 139% of primary wave A. Movement to slightly above 1,470 would avoid a truncation and keep the length of primary wave B closer to the common maximum.
There is no upper invalidation point for this wave count, but significant movement above 1,470 has a low probability.
Wave A blue lasted 87 days (2 short of a Fibonacci 89). Wave B blue lasted 28 days. I would expect wave C blue to be about 34 days in duration. So far it has only lasted 19 days and it should continue for another few weeks or so.
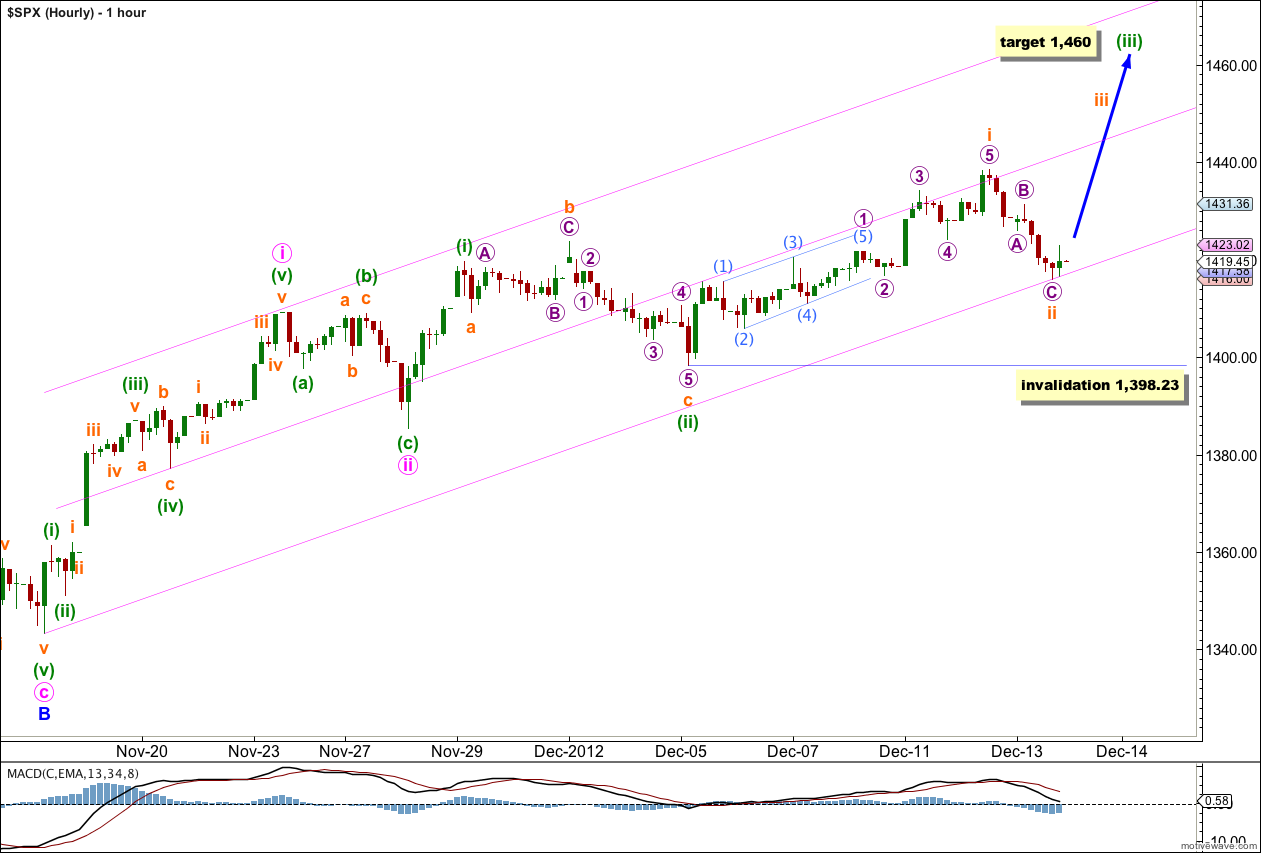
Movement below 1,416.74 invalidated yesterday’s labeling of recent movement and breached the parallel channel as it was drawn yesterday.
No matter how this upwards movement is analysed it cannot be seen as either a complete impulse or an ending diagonal. More upwards movement is required to complete the structure.
This structure is most likely unfolding as an impulse. The middle of the third wave is still required to increase momentum to the upside.
At 1,460 wave (iii) green would reach 1.618 the length of wave (i) green.
Within wave (iii) green wave ii orange may not move beyond the start of wave i orange. This wave count is invalidated with movement below 1,398.23.
“At 1,470 wave C blue would reach 0.618 the length of wave A blue.” this degree.
And Apple just made new lows under 505.75 http://scharts.co/Ui8gXn
Okay.
No, I don’t think wave A blue would be too long in relation to waves B and C blue.
Wave B blue was a 62% correction of wave A blue (extremely close to a Fibonacci 0.618).
At just above 1,470 wave C blue would be 0.618 the length of wave A blue which is a perfectly adequate ratio between the two waves within a zigzag.
Most importantly though at 1,470 primary wave B in it’s entirety would still be just a bit longer than 138% the length of primary wave A. As soon as you get longer than 138% of A the probability of further extension of wave B reduces.
Finally, if it ends about there this wave count will nicely align with the Dow.
Do you see a head and shoulders TOP http://charts.stocktwits.com/production/original_11003940.png?1355438889
Do you think your wave a is too long relative to b and the proposed c ??
which wave degree are you referring to, blue (minor)?