
Last analysis expected upwards movement for Thursday’s session which is what has happened. Price is moving towards the target on the hourly chart.
The wave count remains the same.
Click on the charts below to enlarge.
This wave count will be confirmed with movement above 1,434.27.
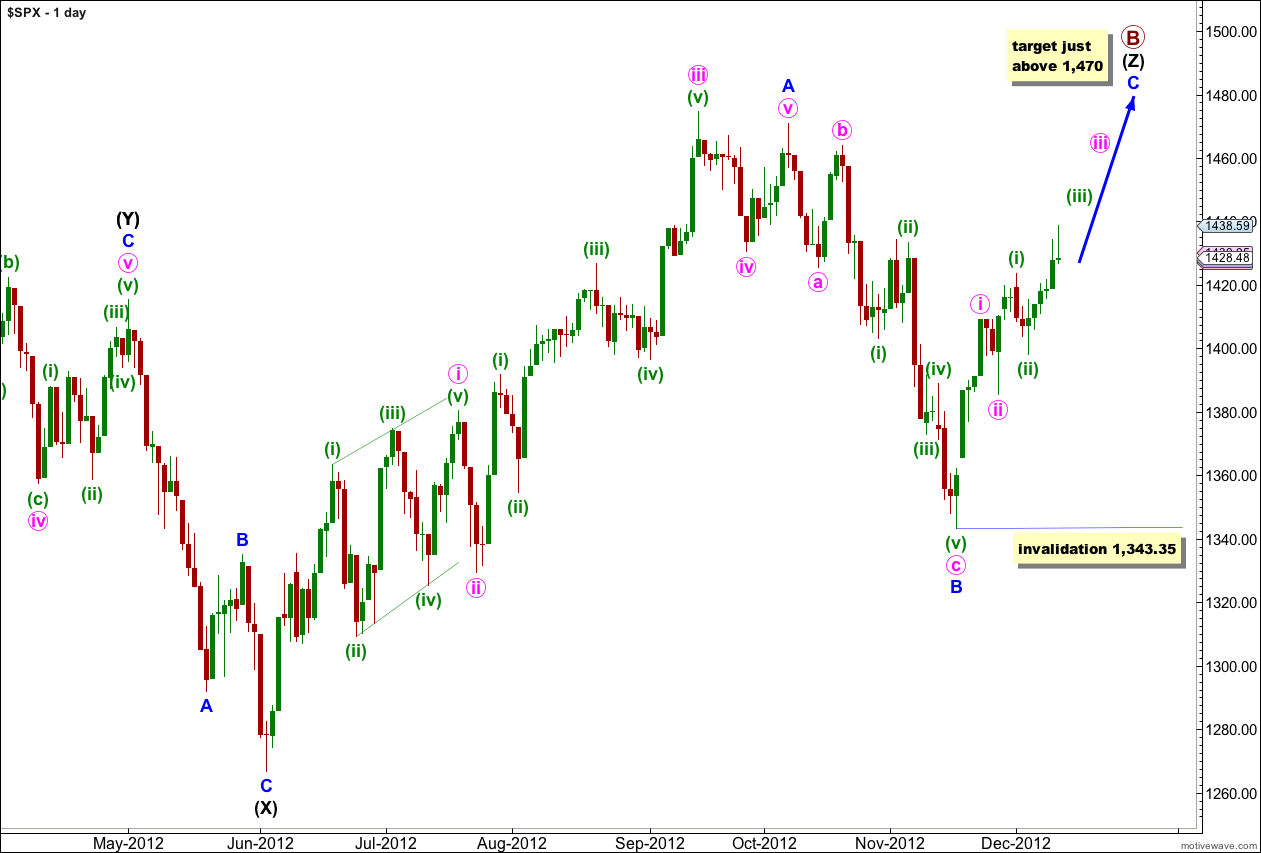
The structure for primary wave B is the same and this wave count is the same at the monthly chart level up to the start of wave (Z) black, the third zigzag in the triple.
Wave (Z) black may be incomplete and may be unfolding as a more exaggerated zigzag.
Wave A blue must be truncated to subdivide into a five wave structure.
At 1,470 wave C blue would reach 0.618 the length of wave A blue. About this point primary wave B would also be only 139% of primary wave A. Movement to slightly above 1,470 would avoid a truncation and keep the length of primary wave B closer to the common maximum.
There is no upper invalidation point for this wave count, but significant movement above 1,470 has a low probability.
Wave A blue lasted 87 days (2 short of a Fibonacci 89). Wave B blue lasted 28 days. I would expect wave C blue to be about 34 days in duration. So far it has only lasted 16 days and it should continue for another month or so.
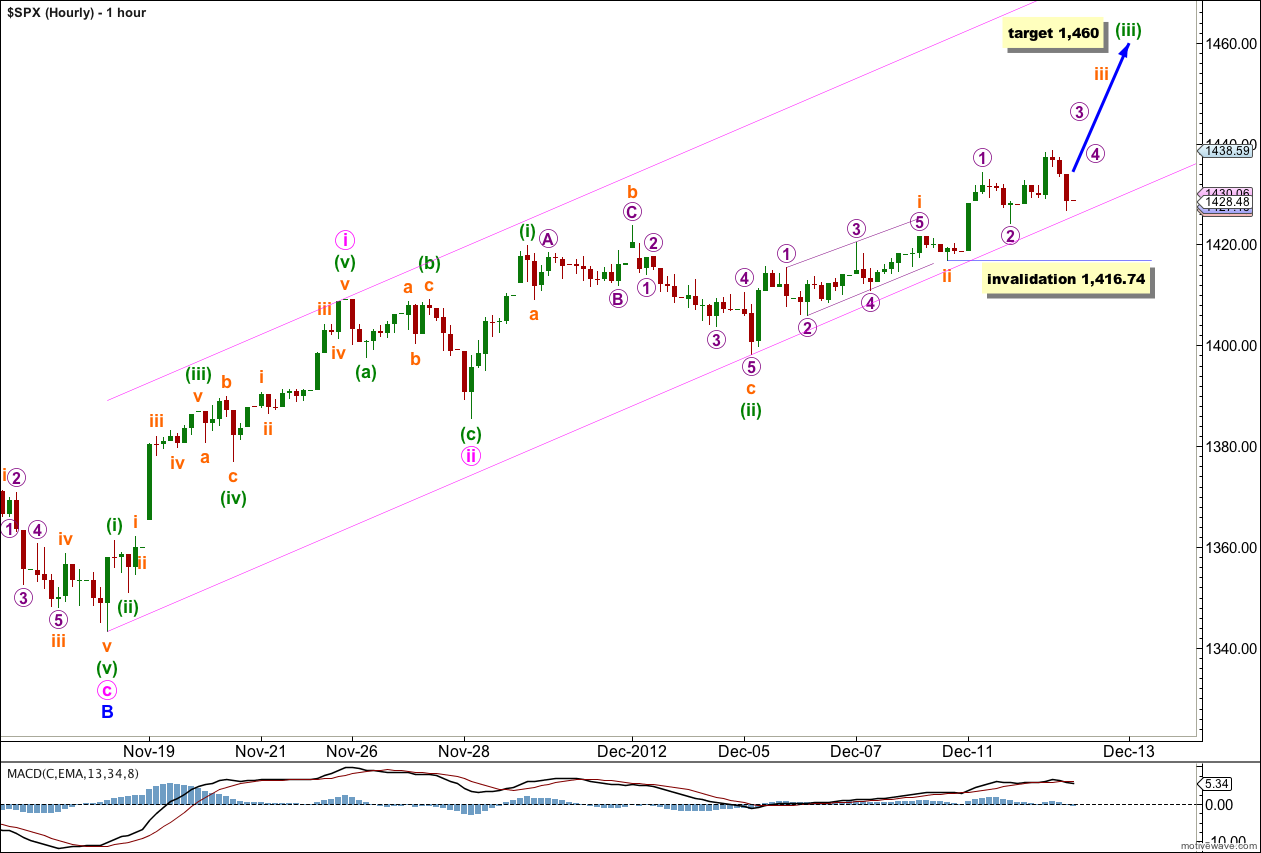
So far upwards movement is overlapping and has not made a new high beyond the end of wave i pink. When the middle of wave iii pink unfolds it can only unfold as an impulse and it should show an increase in momentum beyond that shown by wave i pink.
Price continues to be contained within the best fit parallel channel drawn here. Wave 3 purple and the end of wave iii orange should end closer to the upper edge of the channel.
At 1,460 wave (iii) green would reach 1.618 the length of wave (i) green.
We still need to see the strongest piece of upwards movement unfold as a clear impulse.
Within wave iii orange no second wave correction may move beyond the start of the first wave. This wave count is invalidated with movement below 1,416.74.
NOT here to talk about Sid …
I asked about a double top a few days ago…. and now it looks like we have it — because what the NYMO (McCllellan oscillator ) was showing at that time. BUT I was told the DOW needed more room on the upside.
You do not need to post this … but please send me an email.
On the day you asked I expected you meant had upwards movement ended there? Had we seen the double top there?
If that’s not what you meant then the question made no sense.
Hydeco, Is Lara on vacation … is that why you are talking to me??
I’m here.
The purpose of the comments is to discuss analysis, either with me or between yourselves.
Sorry, you posted just after I did so I thought you were posting me. My mistake!
Sorry bearish not bullish … typo
I do not know if you see my post … I do not so I will try it again.
NYMO has 2 week long bullish divergence http://scharts.co/U86RRm
Do you use this type of indicator??
I use eSignal who for some some reason do not supply $NYMO but instead use a McCllellan oscillator formula of theirs for breadth/advance-decline. I am aware of the bearish divergence and think it is possible at least one wave down has been completed on SPX to reduce current upward movement and be consistent with the bearish divergence.
Maybe there won’t be as much room as Lara has indicated to the upside, but need to understand Sid Norris’s long term count to determine viability of what you have posted on his behalf. That is asking for more of this controlled dribbling up and down movement for multiple years (likely a decade or two). Only real upward impulsive thrust follows deep selloffs like what occurs now to Mar/Jun 2014 with expectations that debt/ponzi has been resolved by then to kicktart 3rd of a 3rd up. For me, Supercycle 4 ending March 2009 is incorrect (with respects to Sid). It is a ridiculous world if Ponzi survives to commence a supercycle 5th wave up by then. FED/Bankers would need to win new world order and that is the worst outcome of all.
Full Aaron Russo film is in the link to illuminate some realities of what is really going on from someone who has in depth experience and the motivation and research capability to pursue the truth. Is 1.5 hours but well worth it.
http://www.youtube.com/watch?v=YGAaPjqdbgQ
Looks like not everyone is looking for more room on the upside http://elliottwavepredictions.com/wp-content/uploads/2012/12/Webinar-Screenshot2.png