
Yesterday’s analysis expected strong downwards movement for Thursday’s session. Price has not moved lower, but instead moved higher within a small range with a lot of sideways movement.
The wave count remains the same. Price remains below the invalidation point on the hourly wave count.
Click on the charts below to enlarge.
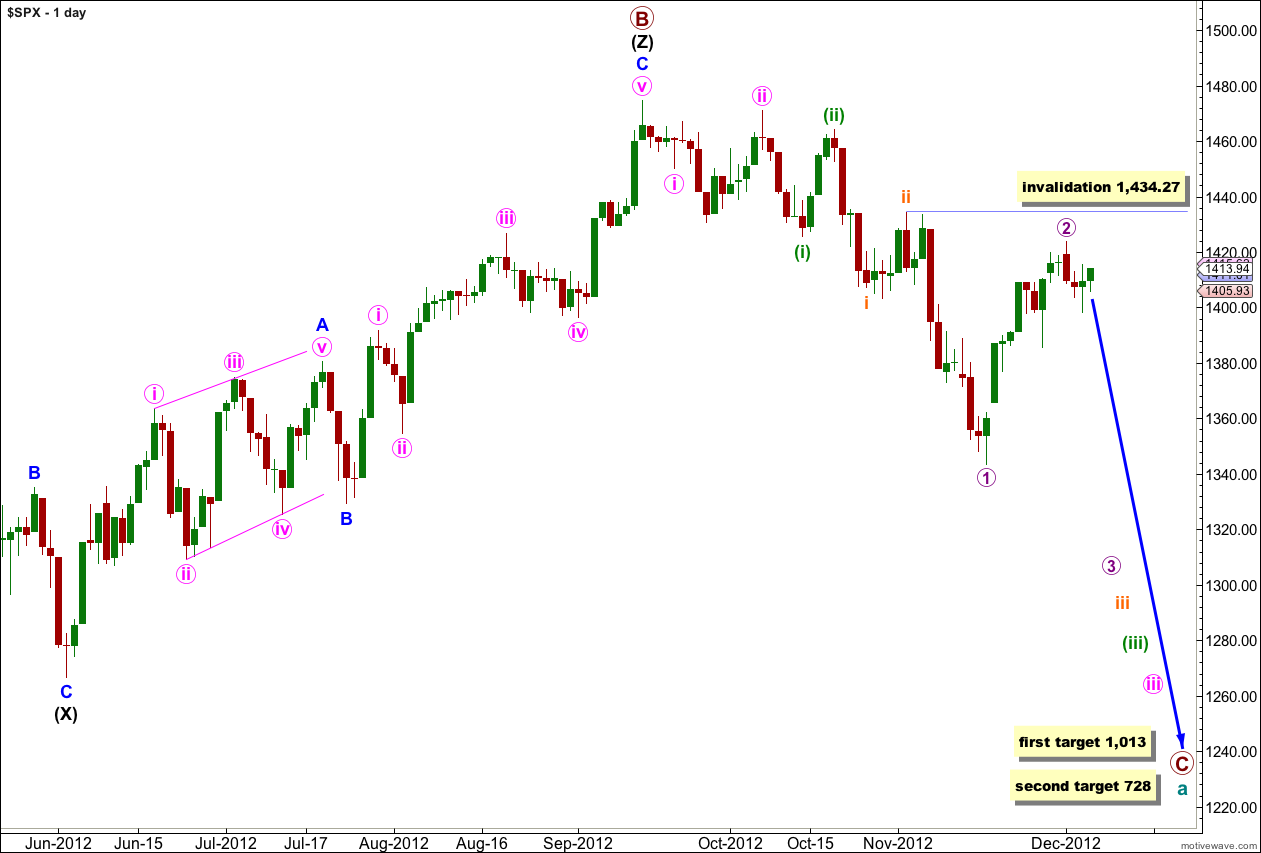
We have recently seen a major trend change in the S&P 500 and the DJIA. This wave count sees the trend at primary degree, so targets are long term and they are months away.
Within the new downwards trend we may be seeing a series of first and second overlapping waves complete. The most commonly extended wave within an impulse is the third wave, and within wave iii pink we should expect wave (iii) green to likely be extended. This necessarily begins with a series of overlapping first and second waves, and this wave count has a very typical look.
Cycle wave a is an expanded flat correction: primary wave A was a three wave structure, and primary wave B was a triple zigzag and 140% the length of primary wave A.
At 1,013 primary wave C would reach 1.618 the length of primary wave A. If price continues downwards through this first target then the next target is at 728 where primary wave C would reach 2.618 the length of primary wave A.
I have tried to see various combinations of a leading diagonal in the first waves after the high of 1,474.51 labeled primary wave B. I cannot find a scenario which fits expected wave lengths for a diagonal, and it would be neither expanding nor contracting. This scenario charted has a much higher probability.
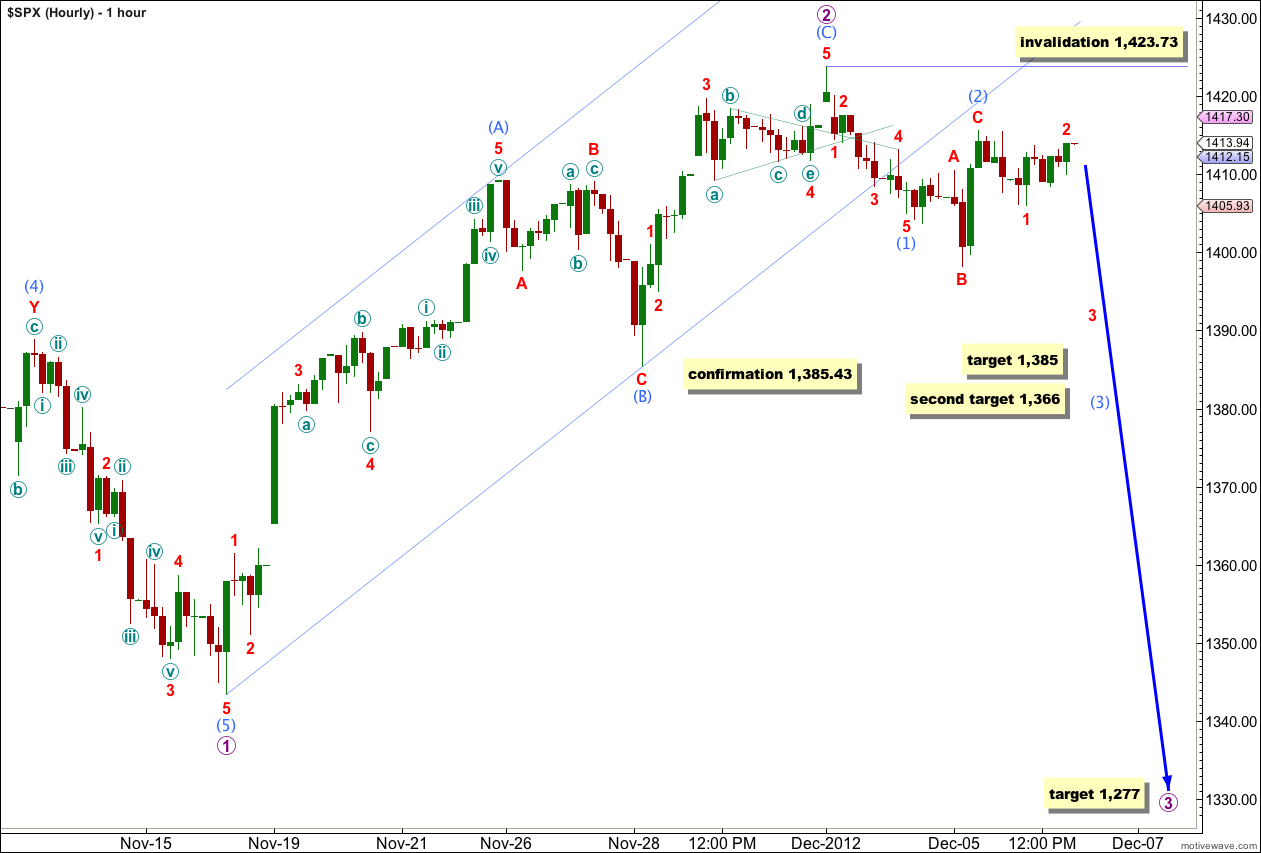
Sideways and slightly higher movement for Thursday’s session may have been another first and second wave, or it may be a continuation of wave 2 purple as a double. The first and second wave is the most likely wave count because the proportions are better.
Wave 2 red is unlikely to be over. The structure on the 5 and 1 minute chart requires a little more upwards movement before it can be considered complete. Wave 2 red may not move beyond the start of wave 1 red above 1,415.56. If price moves above this point then upwards movement would be wave (2) aqua continuing sideways as a double flat or double combination, which also has a good probability.
Wave (2) aqua may not move beyond the start of wave (1) aqua. This wave count is invalidated with movement above 1,423.73.
Each day that does not see strong downwards movement reduces the probability that this wave count is correct. I will spend some time over the weekend looking for a viable alternate which could explain upwards movement above the invalidation point on the daily chart at 1,434.27.
Maybe 1470 was not the high,it does seem pretty corrective down from there.