
Price moved higher as expected for Monday’s session. The short term target for the main hourly wave count was 1,425 – 1,426. Price reached just 1.25 points short of this target zone.
Thereafter, price turned lower and has come to end about the lower edge of the parallel channel on the hourly chart.
The wave count is the same, and at this stage both hourly wave counts expect exactly the same movement next with the same invalidation point and the same target.
Click on the charts below to enlarge.
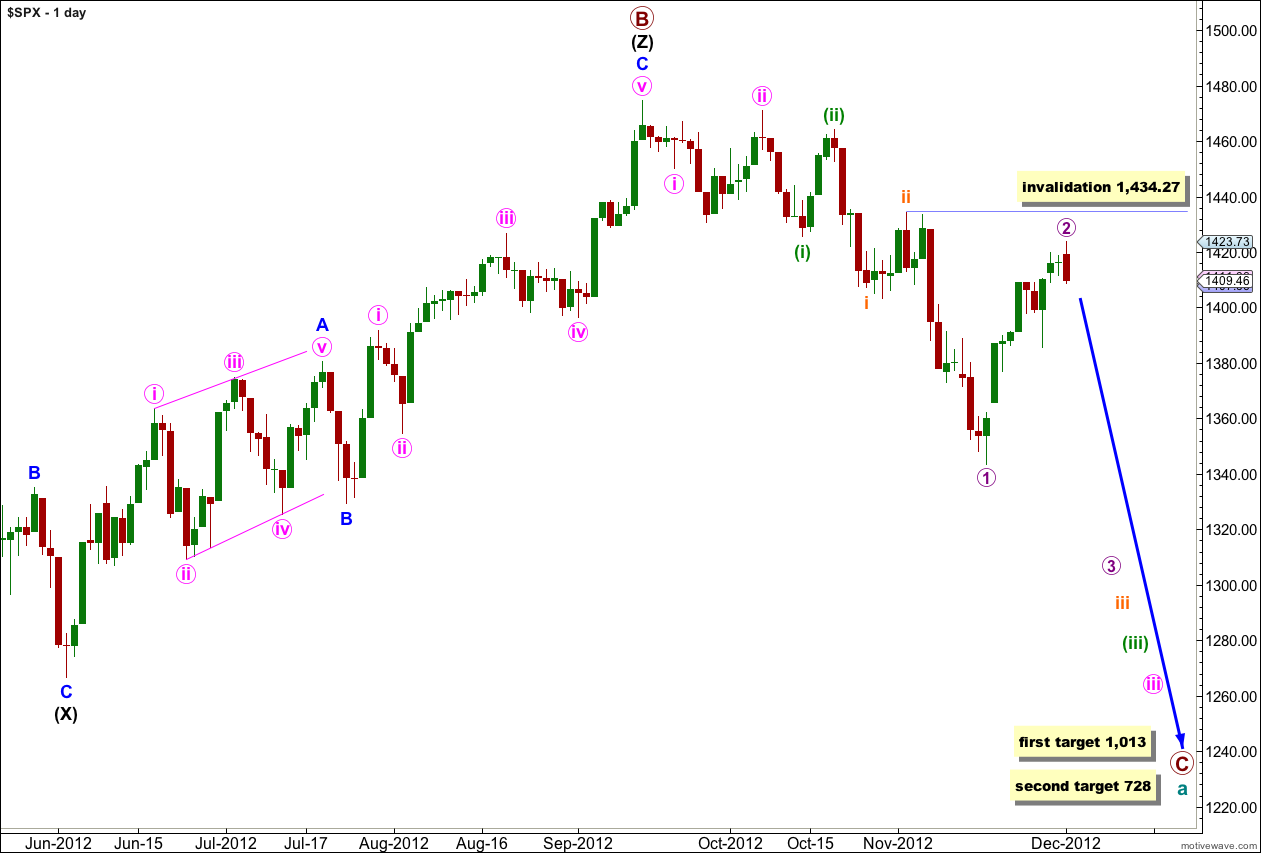
We have recently seen a major trend change in the S&P 500 and the DJIA. This wave count sees the trend at primary degree, so targets are long term and they are months away.
Within the new downwards trend we may be seeing a series of first and second overlapping waves complete. The most commonly extended wave within an impulse is the third wave, and within wave iii pink we should expect wave (iii) green to likely be extended. This necessarily begins with a series of overlapping first and second waves, and this wave count has a very typical look.
Cycle wave a is an expanded flat correction: primary wave A was a three wave structure, and primary wave B was a triple zigzag and 140% the length of primary wave A.
At 1,013 primary wave C would reach 1.618 the length of primary wave A. If price continues downwards through this first target then the next target is at 728 where primary wave C would reach 2.618 the length of primary wave A.
I have tried to see various combinations of a leading diagonal in the first waves after the high of 1,474.51 labeled primary wave B. I cannot find a scenario which fits expected wave lengths for a diagonal, and it would be neither expanding nor contracting. This scenario charted has a much higher probability.
Because the hourly wave counts below have the same invalidation point and the same target I will publish the alternate for the last time today. If they remain the same tomorrow we will use only the main hourly wave count.
Main Hourly Wave Count.
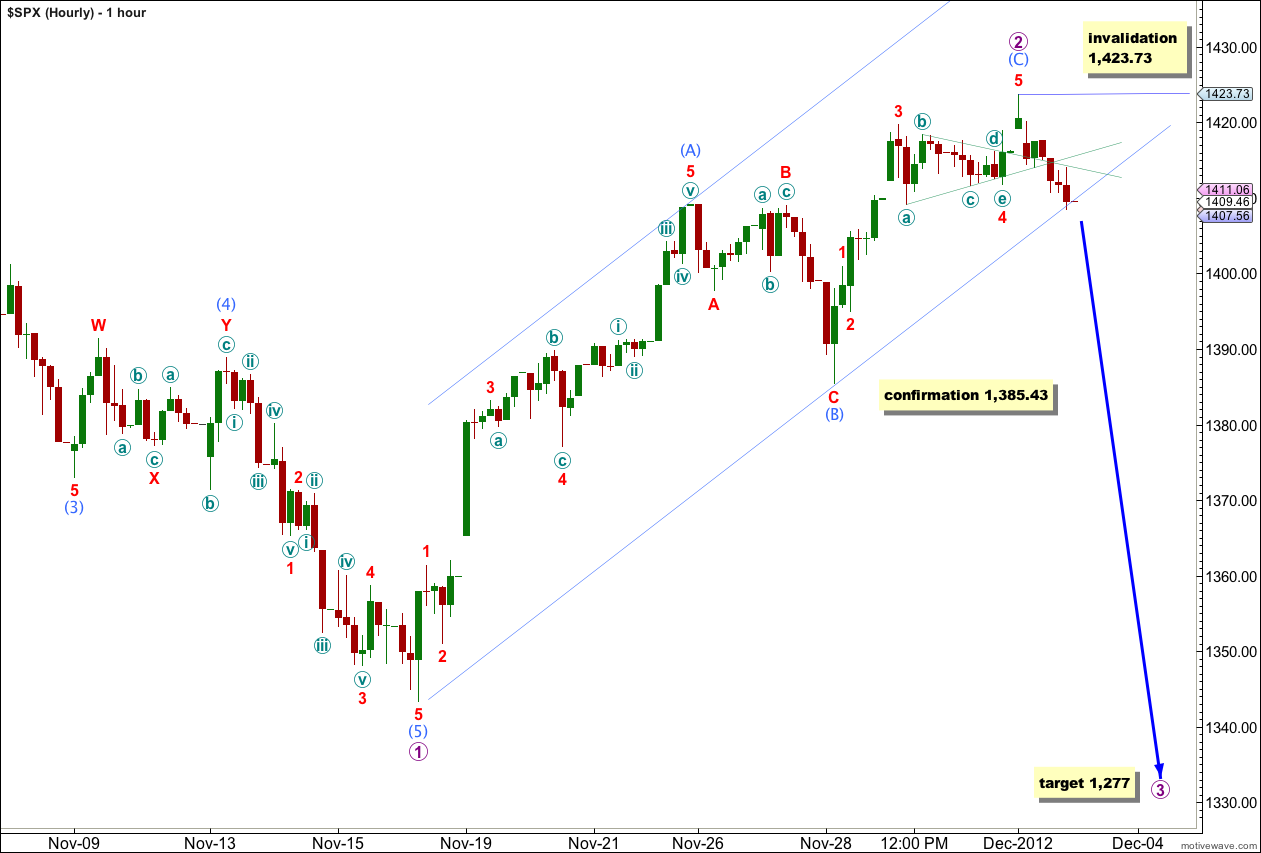
With price movement below 1,409.17 we have an indication that wave 2 purple in its entirety may now be over. Downwards movement may not be a second wave correction within wave 5 red, so wave 5 red must be over.
Wave 4 red may have continued as a triangle and the subdivisions are an okay fit. This would explain the sideways movement. There is alternation between waves 2 and 4 red: wave 2 red is a sharp zigzag and wave 4 red is a shallow sideways triangle. Triangles are usually much more time consuming than zigzags and so the lack of proportion between waves 4 and 2 red with these structures would be somewhat expected.
Downwards movement from Monday’s high has found support at the lower edge of the parallel channel. We need to see this channel breached clearly by downwards movement to have confirmation of this trend change. Further movement below 1,385.43 could not be a second wave correction within wave (C) aqua so at that stage wave (C) aqua would have to be over. This would give us a lot of confidence that wave 2 purple would then be over and wave 3 purple should have begun.
Wave (C) aqua is 2.37 points short of 0.618 the length of wave (A) aqua.
Ratios within wave (C) aqua are: wave 3 red is 0.37 points short of 1.618 the length of wave 1 red, and wave 5 red has no Fibonacci ratio to either of waves 1 or 3 red.
At 1,277 wave 3 purple would reach 1.618 the length of wave 1 purple.
Within wave 3 purple no second wave correction may move beyond the start of its first wave. This wave count is invalidated with movement above 1,423.73.
If this wave count is invalidated with upwards movement then it would be possible that wave 2 purple was continuing further as a double or rare triple zigzag. While we have no trend channel confirmation of this trend change we must accept the possibility that wave 2 purple may continue higher.
Alternate Hourly Wave Count.
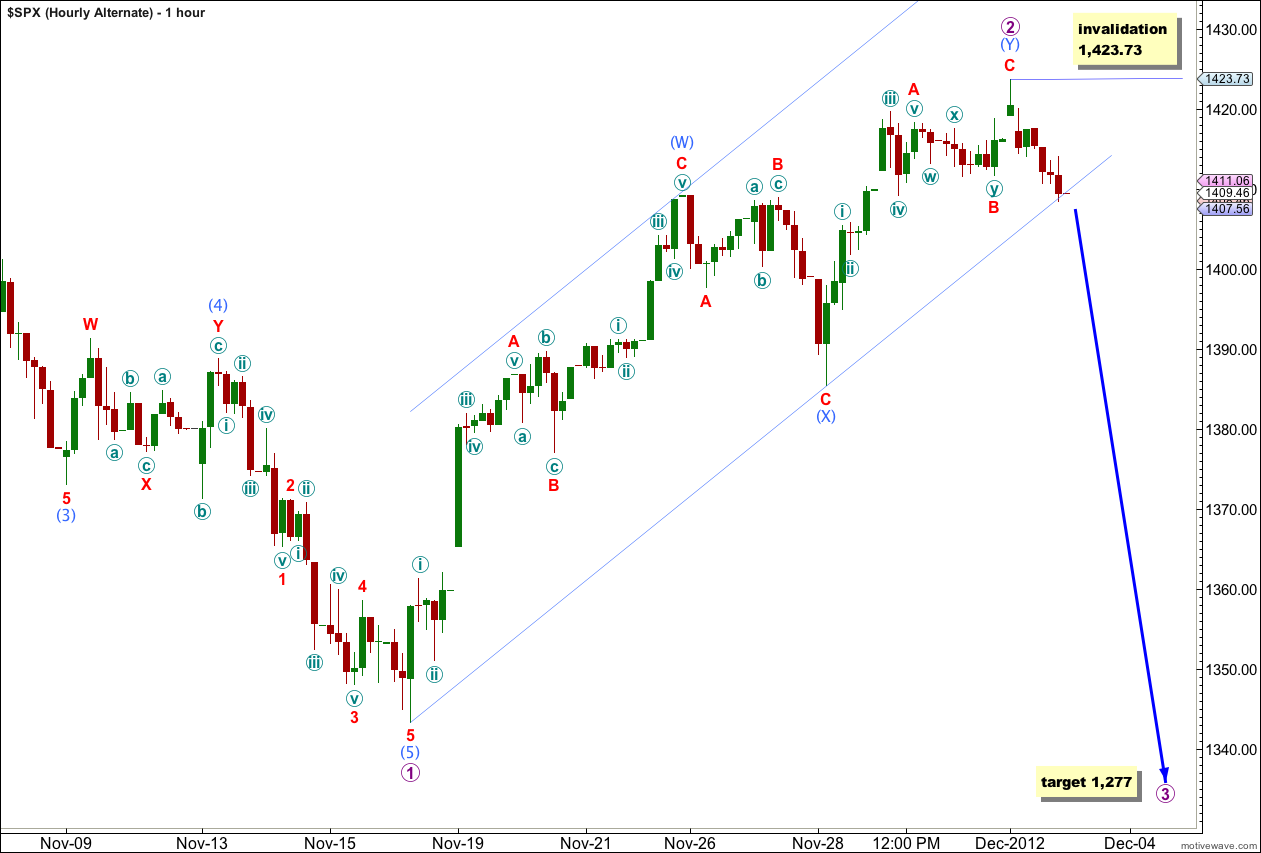
If wave 2 purple is a double zigzag then it too would now be complete.
Within wave (Y) aqua wave C red is 0.63 points short of 0.382 the length of wave A red.
Wave B red may have been a double combination, moving price sideways.
Because price has moved below the start of wave C red at 1,411.77 downwards movement may not be a second wave correction within wave C red and so wave C red must be over.
For this alternate it would be possible that wave 2 purple could continue higher as a very rare triple zigzag, but the rarity of triples makes the probability very low.
The invalidation point and target are the same.
LARA!!!
Thank you very much and bought the double bottom tonight 1401.50 futures for your Wave 2
You’re welcome.
What do you think about this bullish count http://charts.stocktwits.com/production/original_10828037.png?1354647508
The labeling is invalid.
Within a double wave Y cannot itself unfold as a double. You would have to move the degree of labeling within that up one degree and see the structure as a triple. Triples are extremely rare so doing that would give you a very low probability wave count.
Within a double (or triple) waves W, Y (and Z) can only subdivide into one of these structures: zigzag, flat, triangle. They cannot subdivide themselves into combinations.
Refer “Elliott Wave Principle” by Frost and Prechter, 10th edition, page 91 where the structures within combinations, doubles and triples are clearly listed.
Know that feeling so you are not alone. Incorproating doubles into W,X and Y waves is one of my bad habits. It really just makes it a lot more complicated and much simpler to stick to the idea of a flat/zigzag/triangle for one of these waves. Hard to break this mindset but getting better at it.
Lara,
how does your forecast on the S&P chime with Hugo’s main count on the EUR/USD that shows it going up quite significantly?
Firstly, EURUSD and S&P 500 do not have to move together. From a pure Elliott wave perspective they are separate markets and have separate wave counts.
I have looked at Hugo’s new monthly chart and have been in communication with him. I disagree with his order of wave counts, I would swap them around and his alternate would be my main (with an adjustment I’ve spoken about with him).
Look at the monthly wave count for the S&P 500, I have a bullish alternate there.