
Last analysis expected upwards movement for Tuesday’s session from both wave counts. Exactly as expected price has moved higher during Tuesday’s session.
Both wave counts again expect the same direction next. The targets are the same as are the lower invalidation points. There is no divergence at this stage for the short term.
The first and second wave counts still have about an even probability at the monthly chart level. Members may review monthly charts here.
Click on the charts below to enlarge.
First Wave Count.
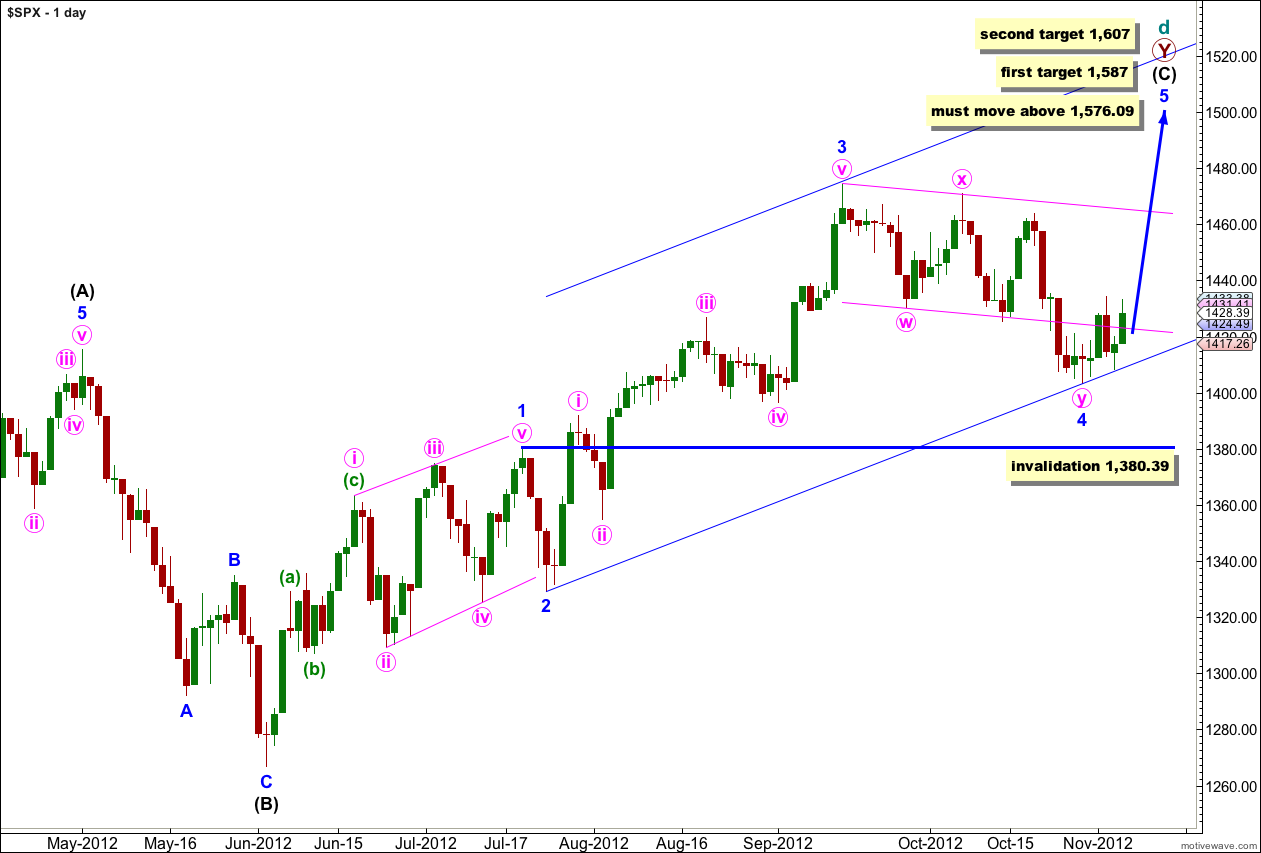
At super cycle degree this wave count sees a very rare expanding triangle unfolding, and cycle wave d upwards within the triangle is a double zigzag which must move beyond the end of cycle wave b at 1,576.09.
Within the second zigzag of the double, primary wave Y, wave (C) black must unfold as a five wave structure.
Waves 1 through to 4 blue are complete. Wave 2 blue unfolded as a brief zigzag, and wave 4 blue was a double zigzag exhibiting alternation.
Further downwards movement for wave 4 blue may not move into wave 1 blue price territory. This wave count is invalidated with movement below 1,380.39.
At 1,587 wave 5 blue would reach 1.618 the length of wave 1 blue. If price passed through this first target we shall use the second.
At 1,607 wave (C) black would reach equality in length with wave (A) black.
Elliott’s second channeling technique may be used about this impulse of wave (C) black. The first trend line is drawn from the lows of 2 to 4 blue, then a parallel copy is placed upon the high of wave 3 blue. Wave 5 blue should end either mid way within the channel or about the upper edge.
If this wave count is invalidated with downwards movement below 1,380.39 then the second daily wave count would be correct. At that stage it would be difficult to see how a large expanding triangle could be unfolding. Movement below 1,266.74 would invalidate the expanding triangle scenario at the monthly chart level and at intermediate degree (please see monthly charts here for an explanation of the wave count at higher degrees).
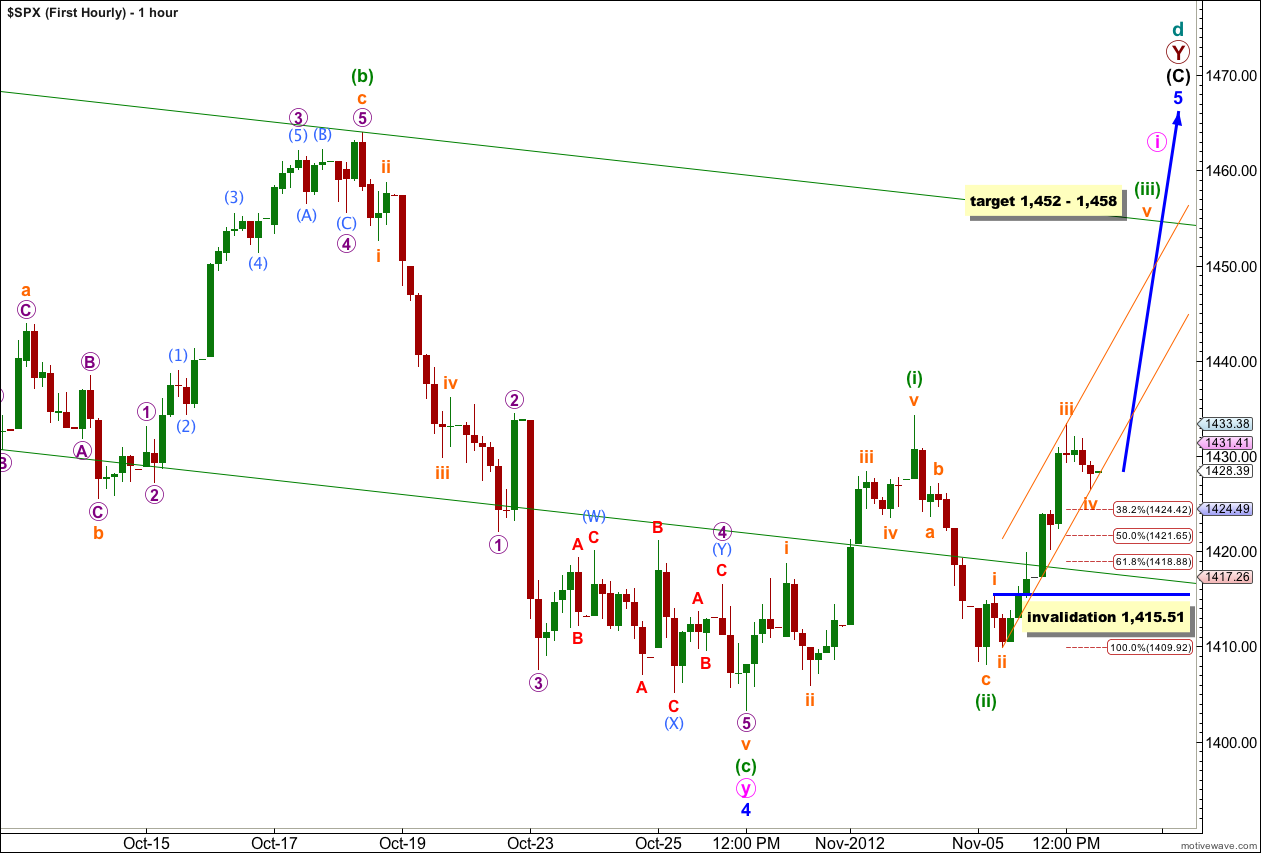
Upwards movement increased in momentum as expected. A low degree third wave may have unfolded.
Within wave (iii) green waves i through to iv orange may be complete. Wave iii orange has no Fibonacci ratio to wave i orange. This makes it more likely that wave v orange will exhibit a Fibonacci ratio to either of waves i or iii orange. At 1,452 wave v orange would reach equality with wave iii orange. This expects wave v orange to be extended.
It is unclear whether or not wave iv orange is complete on the 5 minute chart. It may move lower as it unfolds as a double combination or double zigzag to achieve alternation with wave ii orange which was a single zigzag. Wave ii orange was a deep 76% correction of wave i orange. Wave iv orange is likely to be a shallow correction and may move lower to about the 0.382 Fibonacci ratio of wave iii orange at 1,424.42.
If wave iv orange moves lower then the lower end of the target zone will move correspondingly lower also.
Wave iv orange may not move into wave i orange price territory. This wave count is invalidated with movement below 1,415.51.
When wave iv orange is complete we should expect more upwards movement in an extended fifth wave towards the target zone.
At 1,458 wave (iii) green would reach 1.618 the length of wave (i) green.
Use Elliott’s second channeling technique to draw a small channel about recent upwards movement. Draw the first trend line from the lows of wave ii to iv orange, then place a parallel copy upon the high of wave iii orange. Wave v orange may find resistance at the upper trend line. If wave iv orange moves lower redraw the channel.
Second Wave Count.
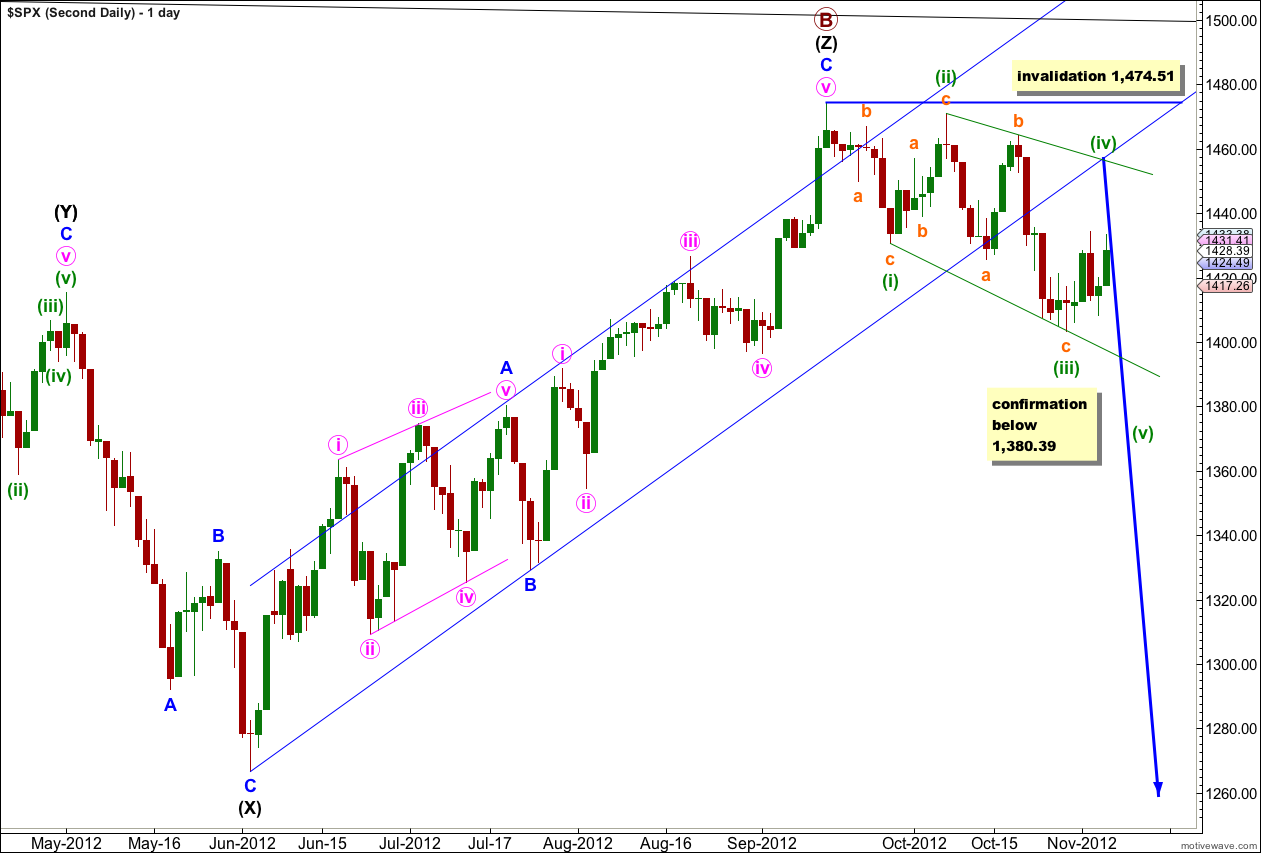
It remains possible that we have recently seen a major trend change in the S&P 500 and the DJIA. We should not place any confidence in this wave count prior to confirmation of a trend change with movement below 1,380.39.
We should always assume that the trend remains the same, until proven otherwise. At this stage we have some indication of a trend change with a clear channel breach, but we will not have price confirmation until we see movement below 1,380.39 invalidating the first daily wave count.
The upper black line is the upper edge of a parallel channel drawn on the monthly chart. This area may have provided resistance.
The channel drawn about the zigzag of wave (Z) black using Elliott’s technique for a correction is very clearly breached. This is some indication that this wave count may be correct and we may have seen a trend change.
Within the new downwards trend no second wave correction may move beyond the start of the first wave. This wave count is invalidated with any movement above 1,474.51.
If we are in a new downwards trend we may have seen a series of overlapping first and second waves, or we may be seeing a leading diagonal unfolding in a first wave position as this chart is labeled above.
If price breaks below 1,380.39 then this would be the preferred wave count and we should expect a new downwards trend for months. At that stage I would calculate downwards targets for you. To do so prior to confirmation would be premature.
At this stage at the monthly chart level this second wave count is about even in probability with the first. This wave count has a primary wave B within a flat correction which is just over 138% the length of primary wave A, reducing the probability. Within primary wave B the structure is a rare triple zigzag further reducing the probability to more even with the first wave count which also has a very rare structure.
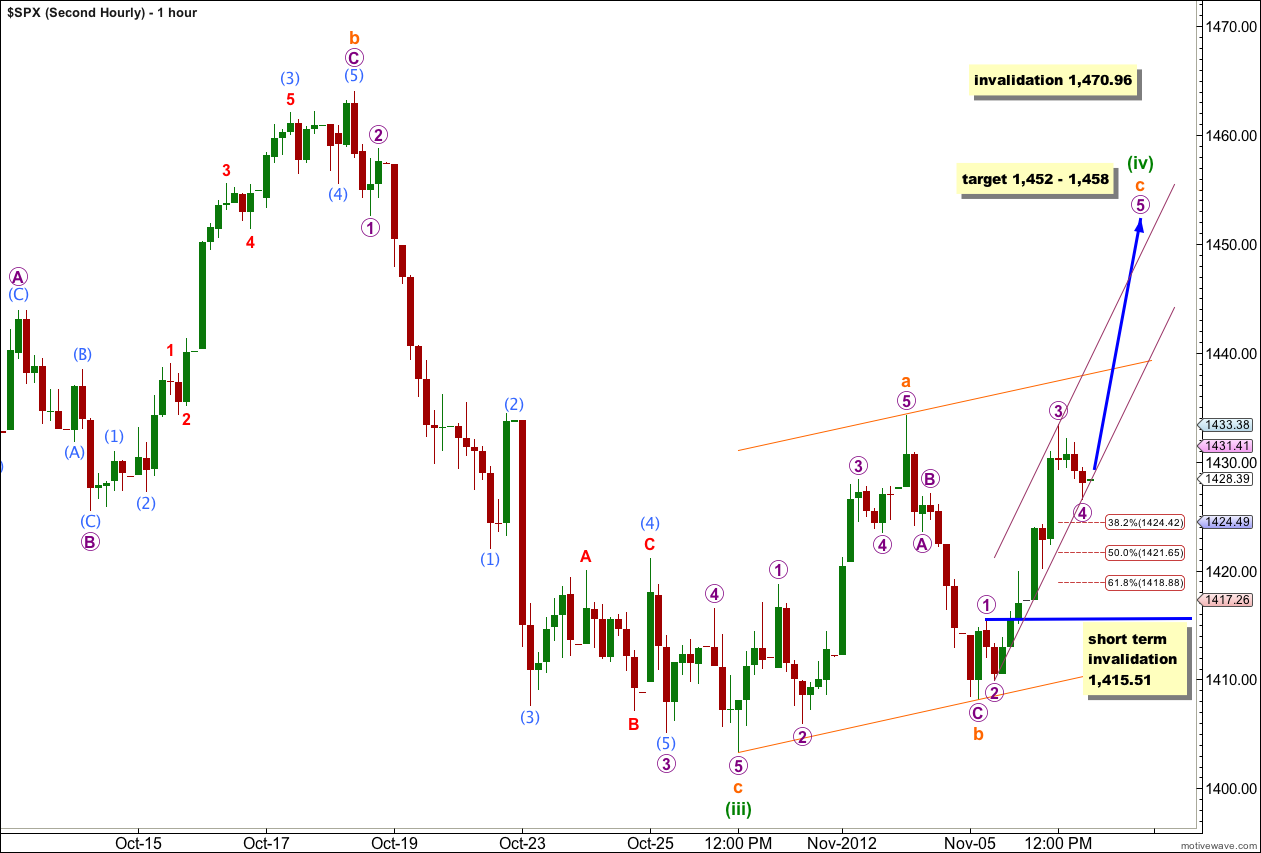
At the hourly chart level at this stage this wave count expects exactly the same movement next as the first wave count. 1-2-3 and A-B-C have exactly the same subdivisions and invalidation points.
The target is also the same. I favour the lower end of the target because it is a lower wave degree.
For this wave count to the up side wave (iv) green of a diagonal may not move beyond the end of wave (ii) green. This wave count is invalidated with movement above 1,470.96.
When wave (iv) green zigzag is complete then this wave count expects a trend change and new lows. Wave (v) green may not be truncated and so must make a new low below the end of wave (iii) green at 1,403.28. At that stage the wave counts will diverge in the short term, at the hourly chart level. Movement below 1,403.28 would provide some confidence in this second wave count and reduce the probability of the first.
Lara,
Thank you so much for the work you do! It is great seeing the alternatives. I remain an ardent fan.
Thanks,
John