
Last analysis was divided with the first and second wave counts diverging in expectation for the next direction. Wednesday’s mostly sideways movement does not make the situation any clearer.
The wave counts are unchanged.
The first and second wave counts still have about an even probability at the monthly chart level. Members may review monthly charts here.
Click on the charts below to enlarge.
First Wave Count.
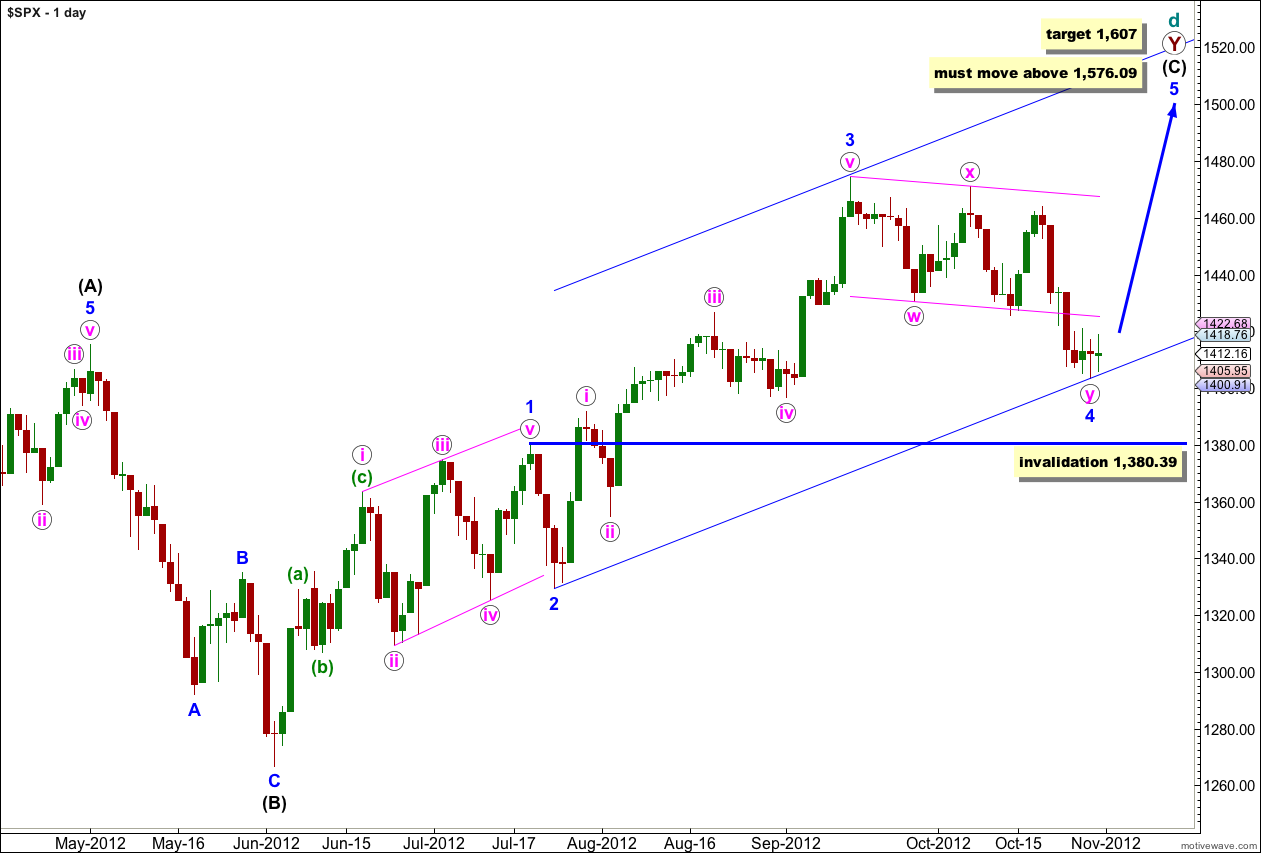
At super cycle degree this wave count sees a very rare expanding triangle unfolding, and cycle wave d upwards within the triangle is a double zigzag which must move beyond the end of cycle wave b.
Within the second zigzag of the double, primary wave Y, wave (C) black must unfold as a five wave structure.
Waves 1 through to 3 blue are complete. Wave 2 blue unfolded as a brief zigzag, and wave 4 blue looks like a double zigzag exhibiting alternation.
Further downwards movement for wave 4 blue may not move into wave 1 blue price territory. This wave count is invalidated with movement below 1,380.39.
At 1,607 wave (C) black would reach equality in length with wave (A) black.
Elliott’s second channeling technique may be used about this impulse of wave (C) black. The first trend line is drawn from the lows of 2 to 4 blue, then a parallel copy is placed upon the high of wave 3 blue. Wave 5 blue should end either mid way within the channel or about the upper edge.
If this wave count is invalidated with downwards movement below 1,380.39 then the second daily wave count would be correct. At that stage it would be difficult to see how a large expanding triangle could be unfolding. Movement below 1,266.74 would invalidate the expanding triangle scenario at the monthly chart level and at intermediate degree (please see monthly charts here for an explanation of the wave count at higher degrees).
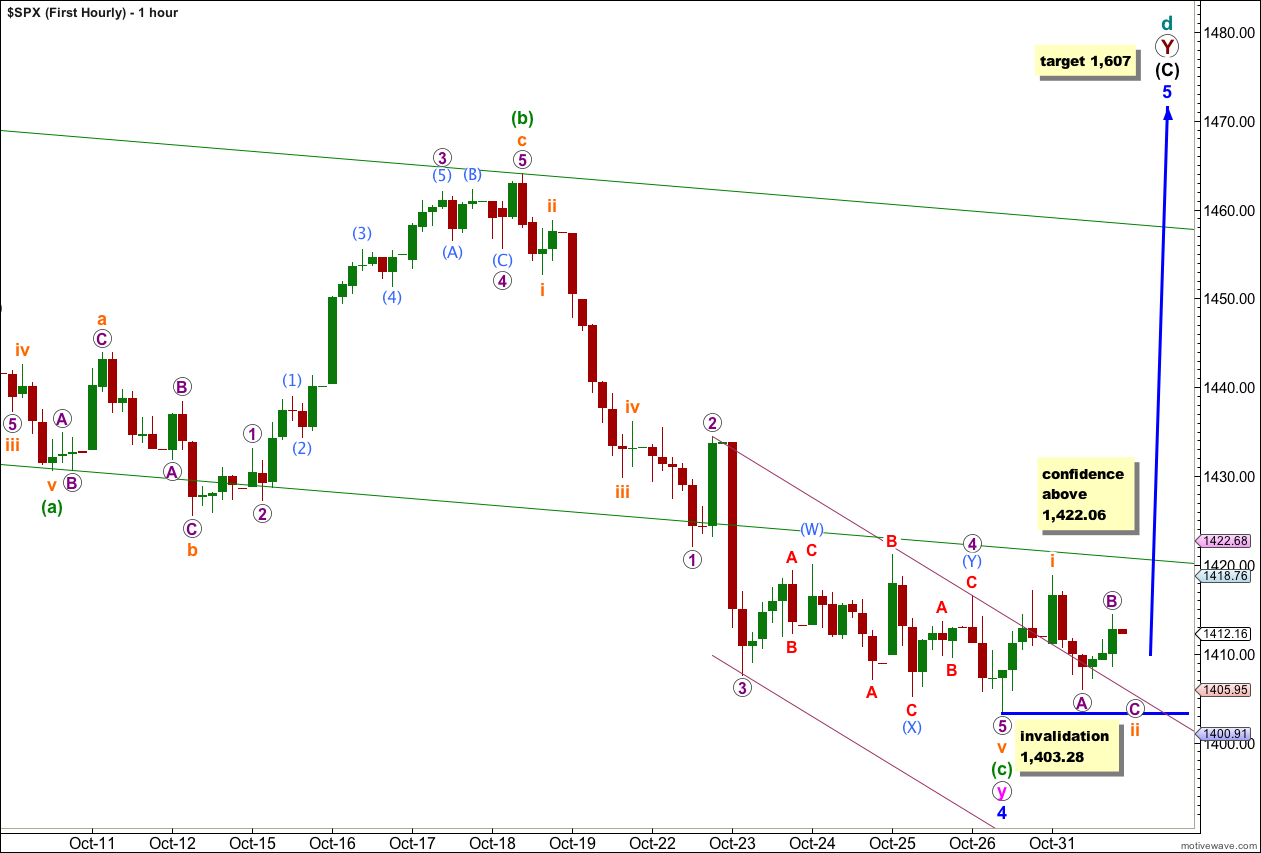
Sideways movement from the low at 1,403.28 so far looks like a five up for a first wave labeled i orange, followed by an incomplete correction for wave ii orange.
The downwards movement labeled wave A purple within wave ii orange subdivides into a five wave impulse, and this cannot be wave ii orange in its entirety.
I would expect a little more downwards movement to begin tomorrow’s session for wave C purple to complete wave ii orange. A short term target would be about the level of wave A purple at 1,406, where wave C purple would reach 0.618 the length of wave A purple.
Wave ii orange may not move beyond the start of wave i orange. This wave count is invalidated in the short term with movement below 1,403.28.
When wave ii orange is complete then this wave count expects upwards movement with an increase in momentum for wave iii orange.
If this wave count is invalidated with downwards movement then wave 4 blue may be extending further. The invalidation point would then move down to where it is on the daily chart at 1,380.39.
Second Wave Count.
It remains possible that we have recently seen a major trend change in the S&P 500 and the DJIA. We should not place any confidence in this wave count prior to confirmation of a trend change with movement below 1,380.39.
We should always assume that the trend remains the same, until proven otherwise. At this stage we have a little indication of a trend change with a clear channel breach, but we will not have price confirmation until we see movement below 1,380.39 invalidating the first daily wave count.
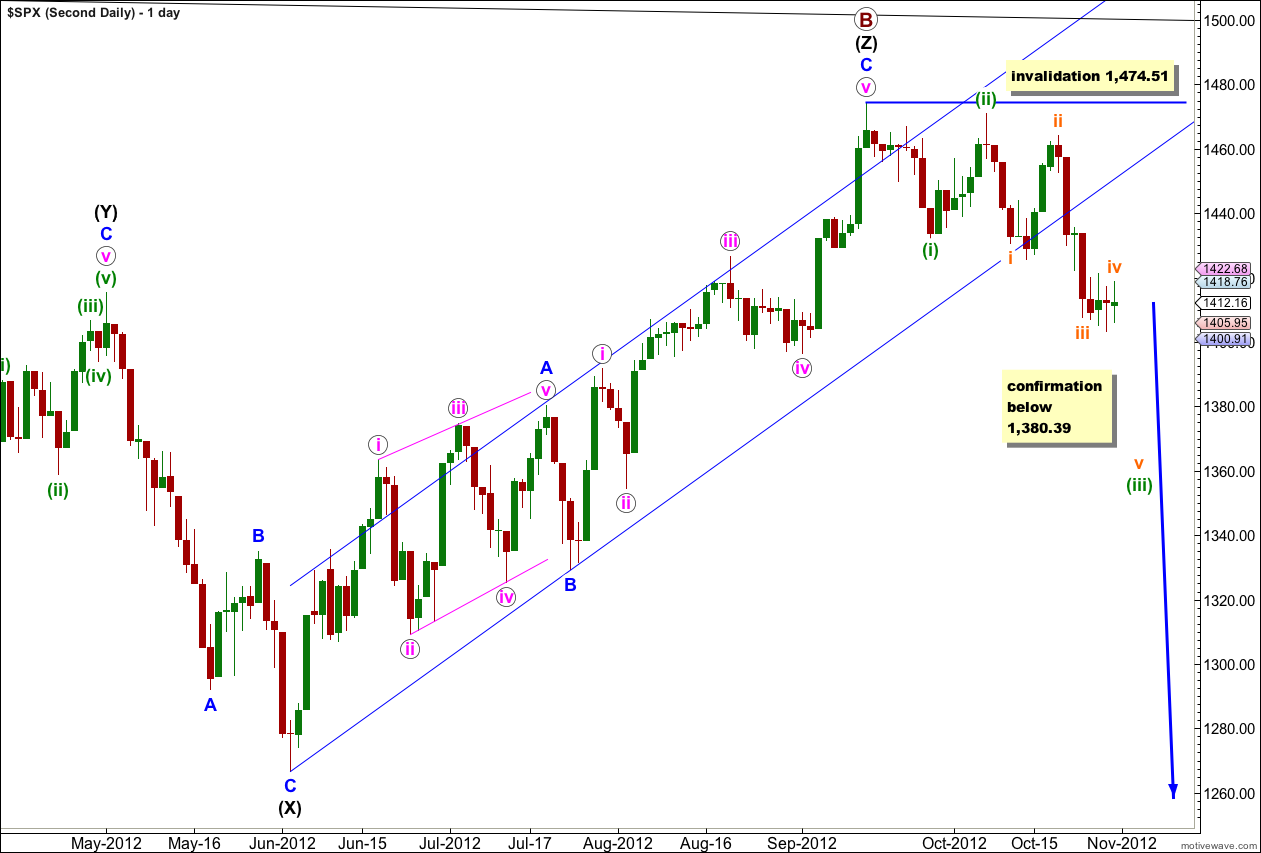
The upper black line is the upper edge of a parallel channel drawn on the monthly chart. This area may have provided resistance.
The channel drawn about the zigzag of wave (Z) black using Elliott’s technique for a correction is very clearly breached. This is some indication that this wave count may be correct and we may have seen a trend change.
Within the new downwards trend no second wave correction may move beyond the start of the first wave. This wave count is invalidated with any movement above 1,474.51.
If we are in a new downwards trend we may have seen a series of overlapping first and second waves.
If price breaks below 1,380.39 then this would be the preferred wave count and we should expect a new downwards trend for months. At that stage I would calculate downwards targets for you. To do so prior to confirmation would be premature.
At this stage at the monthly chart level this second wave count is about even in probability with the first. This wave count has a primary wave B within a flat correction which is just over 138% the length of primary wave A, reducing the probability. Within primary wave B the structure is a rare triple zigzag further reducing the probability to more even with the first wave count which also has a very rare structure.
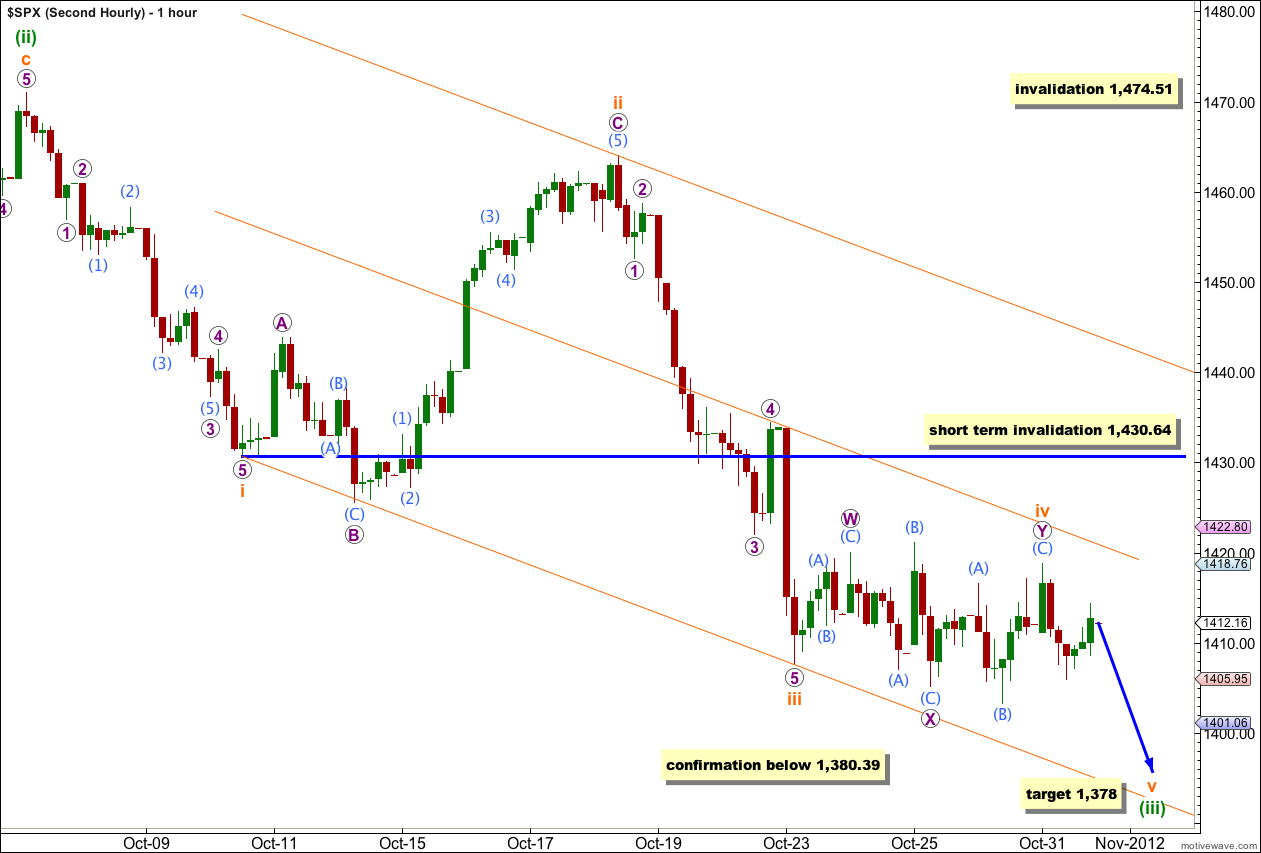
Today I will publish this chart on a one hourly time frame. To see the subdivisions within waves (i) and (ii) green you may view the two hourly time frame in this analysis here.
Within wave (iii) green waves i through to iv orange may be complete.
At 1,378 wave v orange would reach equality in length with wave i orange. There is no Fibonacci ratio between waves i and iii orange so a ratio between wave v orange and either of i or iii is more likely.
Wave ii orange was a relatively deep expanded flat correction, and wave iv orange is now a relatively shallow double combination correction (wave W purple is a zigzag and wave Y purple is a flat). This gives perfect alternation.
Wave iv orange has moved further sideways and now as a double combination makes more sense than prior labeling as a double zigzag. Double combinations have the purpose of moving price sideways which is what this does.
The parallel channel is drawn using Elliott’s first technique. The first trend line is drawn from the lows of waves i to iii orange, and a parallel copy is placed upon the high of wave ii orange. I have created another parallel copy to place in the midline of the channel. Wave v orange is likely to be contained within the lower half of the channel, and may end about the lower edge.
When this channel is clearly breached by upwards movement above the upper trend line then wave (iii) green should be over and wave (iv) green would be underway.
At this stage any further movement of wave iv orange, if it extends as a rare triple, may not move into wave i orange price territory. This wave count is invalidated with movement above 1,430.64.
Movement below 1,380.39 would provide strong confirmation for this wave count at both hourly and daily chart levels.