
Last analysis expected upwards movement from the S&P for Friday’s session, but did allow for downwards movement and a confidence point was provided. Price did not reach the confidence price point and no confidence could be had in a trend change. Price moved slightly lower in mostly sideways movement for the session.
The wave counts remain valid. The first and second wave counts still have about an even probability at the monthly chart level. Members may review monthly charts here.
I have an hourly chart today for the second wave count.
Click on the charts below to enlarge.
First Wave Count.
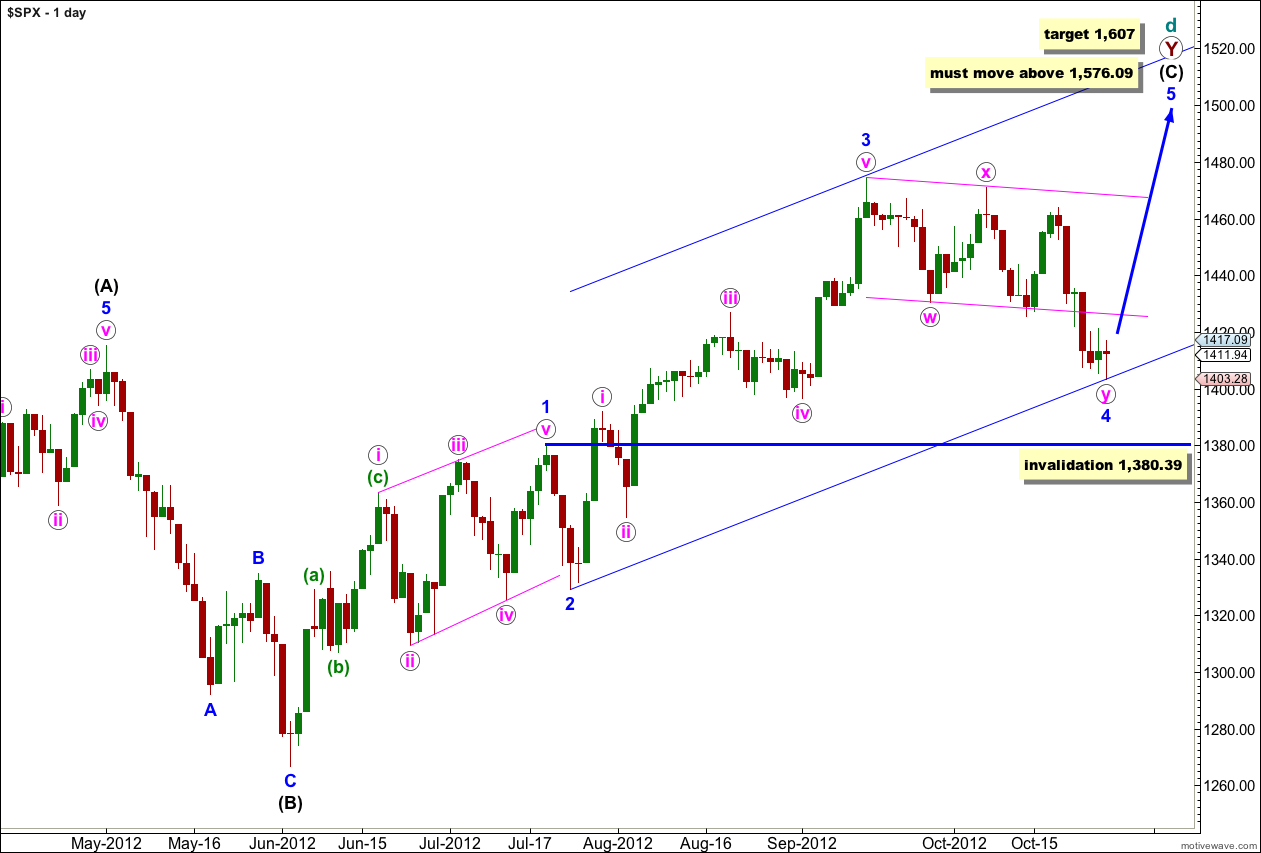
At super cycle degree this wave count sees a very rare expanding triangle unfolding, and cycle wave d upwards within the triangle is a double zigzag which must move beyond the end of cycle wave b.
Within the second zigzag of the double, primary wave Y, wave (C) black must unfold as a five wave structure.
Waves 1 through to 3 blue are complete. Wave 2 blue unfolded as a brief zigzag, and wave 4 blue looks like a double zigzag exhibiting alternation.
Further downwards movement for wave 4 blue may not move into wave 1 blue price territory. This wave count is invalidated with movement below 1,380.39.
At 1,607 wave (C) black would reach equality in length with wave (A) black.
Elliott’s second channeling technique may be used about this impulse of wave (C) black. The first trend line is drawn from the lows of 2 to 4 blue, then a parallel copy is placed upon the high of wave 3 blue. Wave 5 blue should end either mid way within the channel or about the upper edge.
If this wave count is invalidated with downwards movement below 1,380.39 then the second daily wave count would be correct. At that stage it would be difficult to see how a large expanding triangle could be unfolding. Movement below 1,266.74 would invalidate the expanding triangle scenario at the monthly chart level and at intermediate degree (please see monthly charts here for an explanation of the wave count at higher degrees).
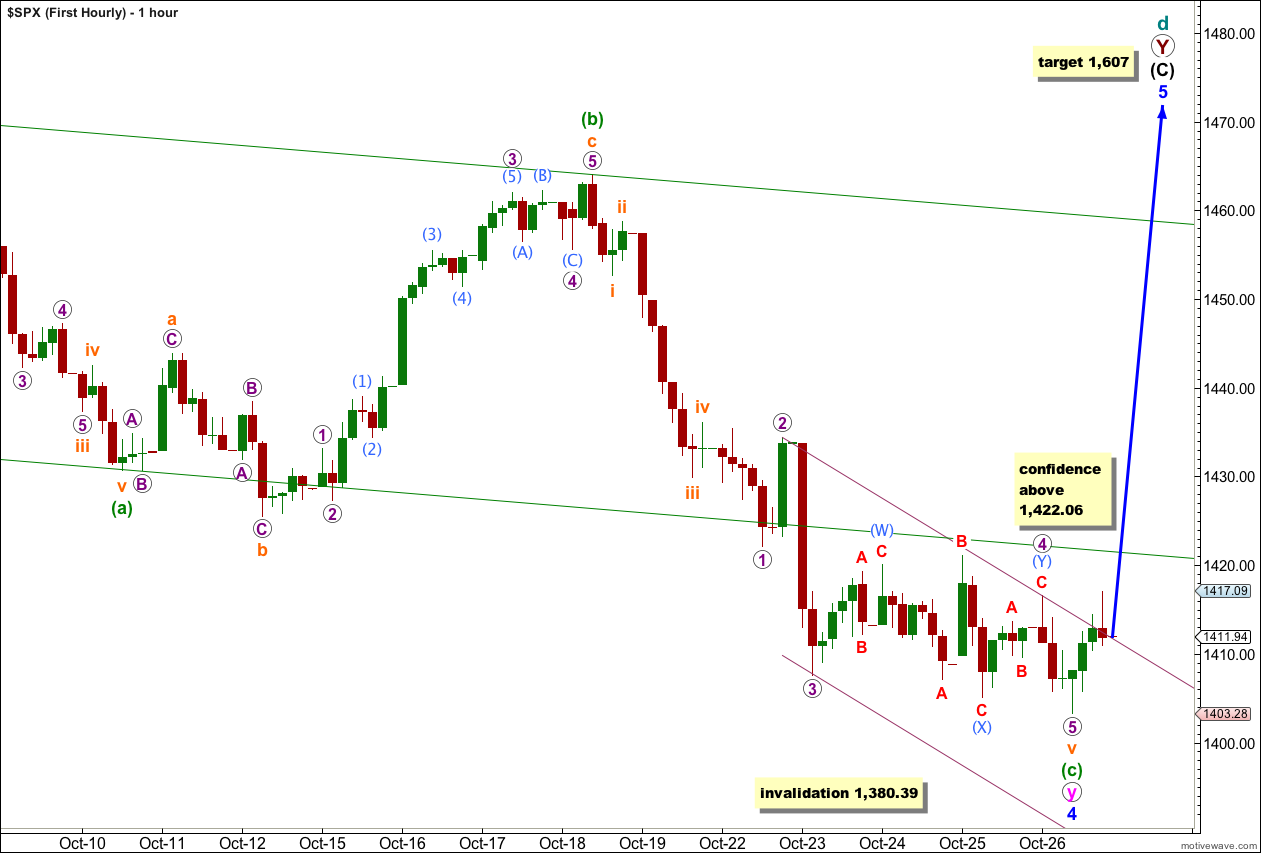
Downwards movement to a slight new low during Friday’s session may have come after an extension of wave 4 purple further sideways as a double zigzag. However, the purpose of a double zigzag is to deepen a correction. In this case that is not what this structure has done. In fact, it slopes with the impulsive trend and has properties of a running flat. This reduces the probability of this wave count (at the hourly chart level).
Wave 4 purple is now too far out of proportion to wave 2 purple. This further reduces the probability of this wave count at the hourly chart level.
Within the extension of wave v orange within wave (c) green, if wave 4 purple moves any higher it may not move into wave 1 purple price territory. Movement above 1,422.06 would confirm that wave v orange would have to be over as at that stage upwards movement would not be a fourth wave correction.
Movement above the green parallel channel drawn about the zigzag of wave y pink would provide trend channel confirmation that the correction is over and an upwards trend has resumed.
Wave (c) green is now 4.5 points short of 1.618 the length of wave (a) green.
Ratios within wave (c) green are: wave iii orange is 0.93 points short of 2.618 the length of wave i orange, and wave v orange has no Fibonacci ratio to either of waves iii or i orange.
Ratios within wave v orange extension are: wave 3 purple has no Fibonacci ratio to wave 1 purple, and wave 5 purple is 0.8 points short of equality with wave 1 purple.
While price remains below the confidence point we must accept the possibility that wave 4 blue may not be over and could continue lower. Wave 4 blue may not move into wave 1 blue price territory. This wave count is invalidated with movement below 1,380.39.
Second Wave Count.
It remains possible that we have recently seen a major trend change in the S&P 500 and the DJIA. We should not place any confidence in this wave count prior to confirmation of a trend change with movement below 1,380.39.
We should always assume that the trend remains the same, until proven otherwise. At this stage we have a little indication of a trend change with a clear channel breach, but we will not have price confirmation until we see movement below 1,380.39 invalidating the first daily wave count.
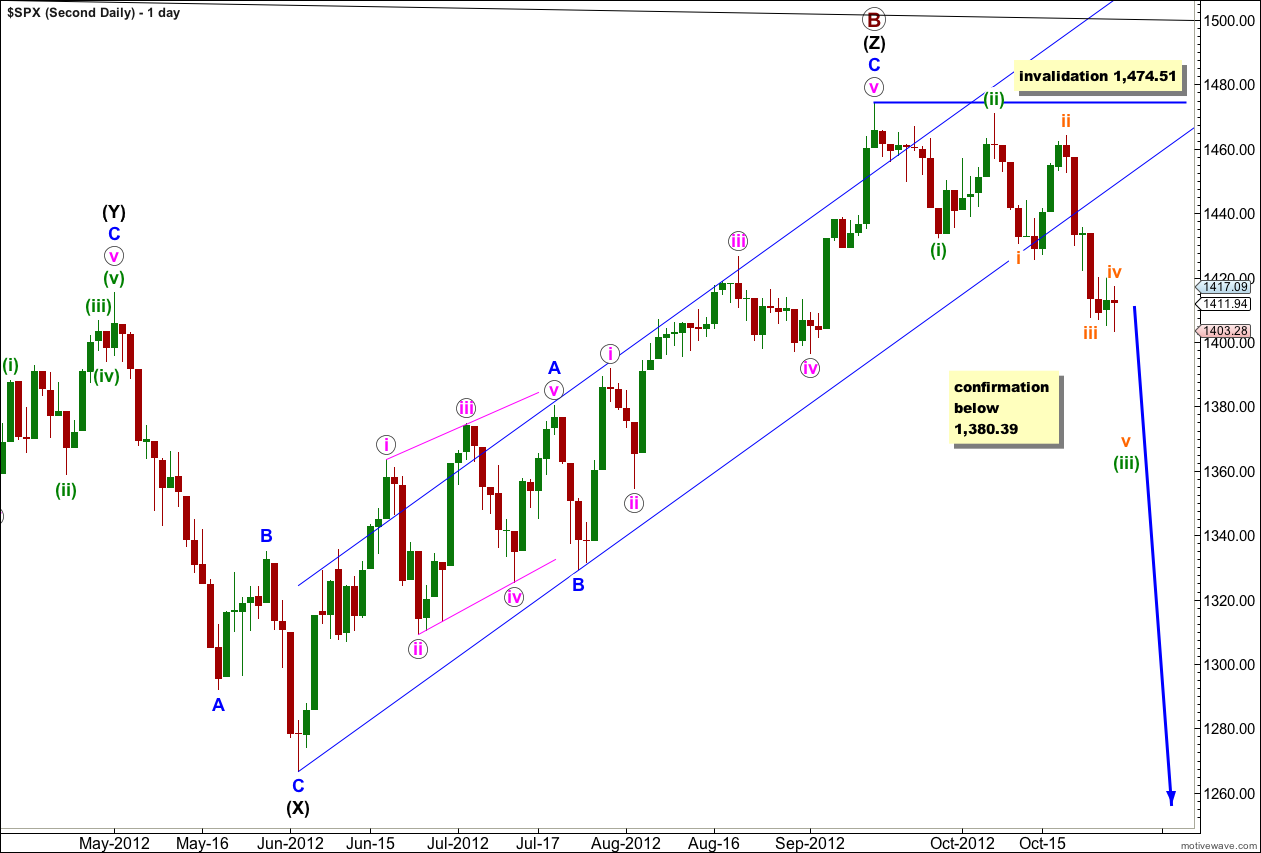
The upper black line is the upper edge of a parallel channel drawn on the monthly chart. This area may have provided resistance.
The channel drawn about the zigzag of wave (Z) black using Elliott’s technique for a correction is very clearly breached. This is some indication that this wave count may be correct and we may have seen a trend change.
Within the new downwards trend no second wave correction may move beyond the start of the first wave. This wave count is invalidated with any movement above 1,474.51.
If we are in a new downwards trend we may have seen a series of overlapping first and second waves.
If price breaks below 1,380.39 then this would be the preferred wave count and we should expect a new downwards trend for months. At that stage I would calculate downwards targets for you. To do so prior to confirmation would be premature.
At this stage at the monthly chart level this second wave count is about even in probability with the first. This wave count has a primary wave B within a flat correction which is just over 138% the length of primary wave A, reducing the probability. Within primary wave B the structure is a rare triple zigzag further reducing the probability to more even with the first wave count which also has a very rare structure.
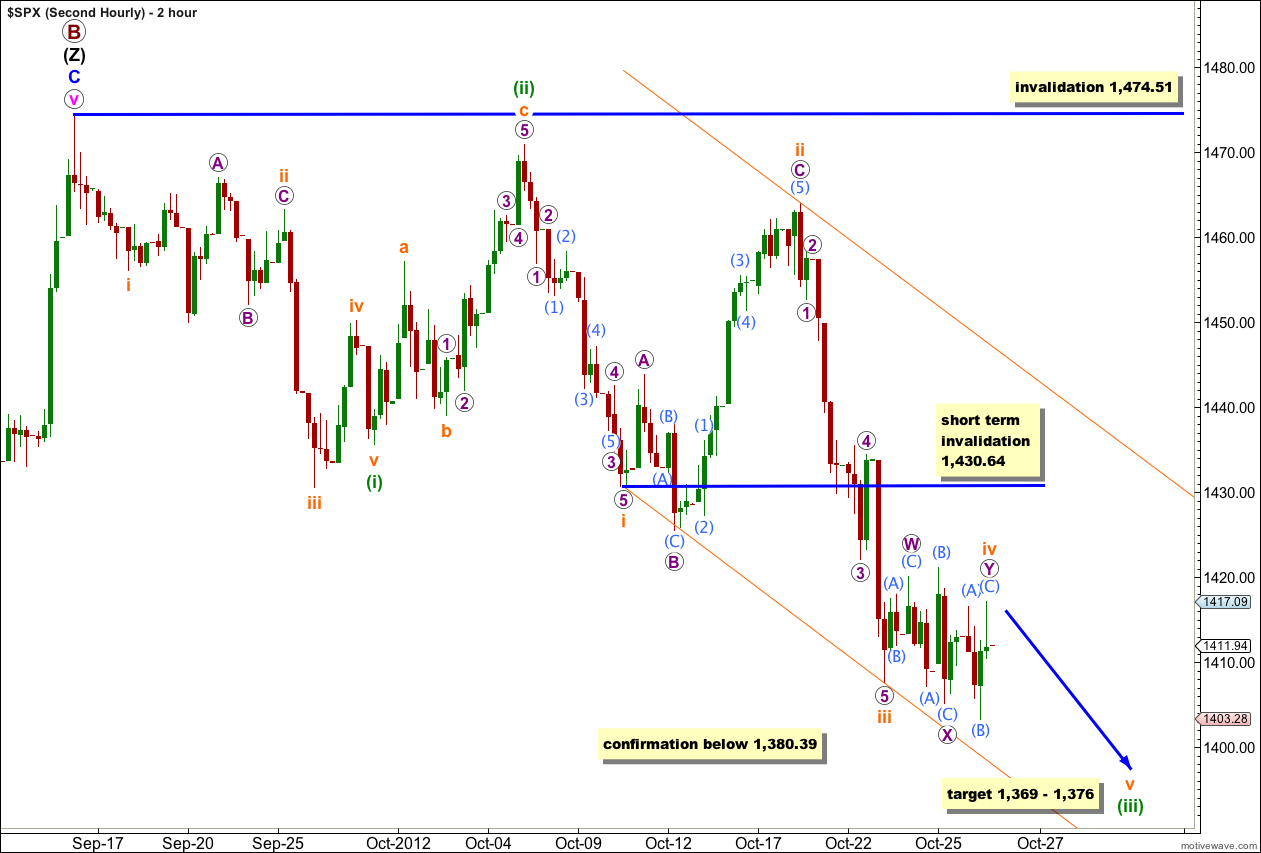
This hourly wave count will be presented on a 2 hourly chart for this end of week analysis to show all the detail from the high, and in subsequent days will be on an hourly chart.
If we have seen a trend change then we may have seen so far two overlapping first and second waves.
Wave (i) green may have ended with a truncated fifth wave. Wave (ii) green is an extremely deep correction.
Wave (iii) green would most likely be incomplete. At 1,369 wave (iii) green would reach 2.618 the length of wave (i) green.
Within wave (iii) green wave iii orange has no Fibonacci ratio to wave i orange. This makes it more likely that wave v orange will exhibit a Fibonacci ratio to either of i or iii orange. At 1,376 wave v orange would reach equality in length with wave i orange.
I favour the upper end of this target zone because it is at a lower wave degree.
We may use Elliott’s first channeling technique to draw a channel about this downwards movement. Draw the first trend line from the lows of waves i to iii orange, then place a parallel copy upon the high of wave ii orange. Wave v orange should end mid way within this channel, or about the lower edge.
In the short term any further upwards movement of wave iv orange if it extends may not move into wave i orange price territory. This wave count is invalidated in the short term with movement above 1,430.64.
When a possible fifth wave for wave v orange is complete then the invalidation point must move up to the price extreme of wave (i) green at 1,430.53.
Movement above 1,474.51 would firmly invalidate this wave count as no second wave correction within the new downwards trend may move beyond the start of a first wave.