
Yesterday’s analysis expected more downwards movement for Thursday’s session to a short term target at 1,403 to 1,399, favouring the upper edge of the target zone. Price has reached down to 1,405.14, 2.14 points short of the target.
The wave count remains the same.
The first and second daily wave counts are different at cycle degree. Members may review monthly charts here.
Click on the charts below to enlarge.
First Daily Wave Count.
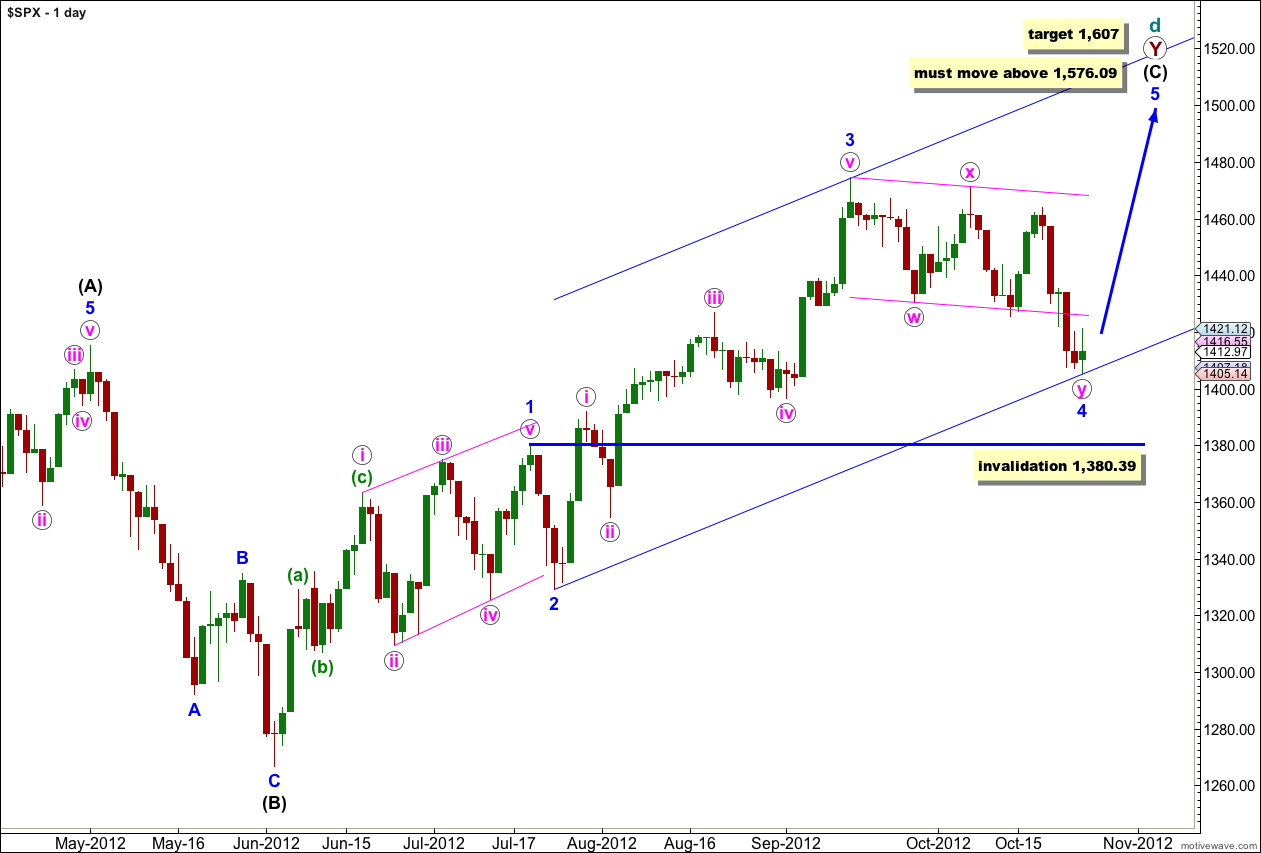
At super cycle degree this wave count sees a very rare expanding triangle unfolding, and cycle wave d upwards within the triangle is a double zigzag which must move beyond the end of cycle wave b.
Within the second zigzag of the double, primary wave Y, wave (C) black must unfold as a five wave structure.
Waves 1 through to 3 blue are complete. Wave 2 blue unfolded as a brief zigzag, and wave 4 blue looks like a double zigzag exhibiting alternation.
Further downwards movement for wave 4 blue may not move into wave 1 blue price territory. This wave count is invalidated with movement below 1,380.39.
At 1,607 wave (C) black would reach equality in length with wave (A) black.
Elliott’s second channeling technique may be used about this impulse of wave (C) black. The first trend line is drawn from the lows of 2 to 4 blue, then a parallel copy is placed upon the high of wave 3 blue. Wave 5 blue should end either mid way within the channel or about the upper edge.
If this wave count is invalidated with downwards movement below 1,380.39 then the second daily wave count would be correct. At that stage it would be difficult to see how a large expanding triangle could be unfolding. Movement below 1,266.74 would invalidate the expanding triangle scenario at the monthly chart level and at intermediate degree (please see monthly charts here for an explanation of the wave count at higher degrees).
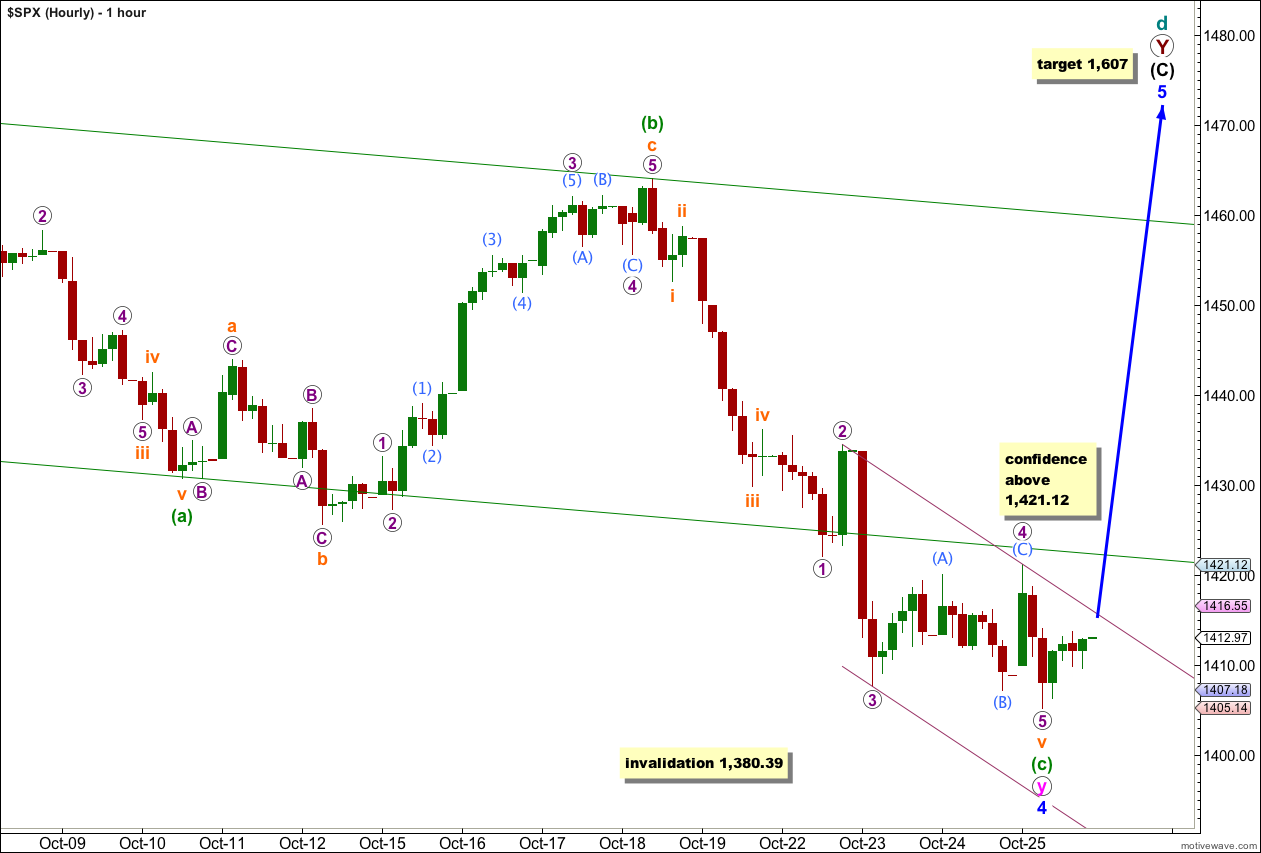
At the start of Thursday’s session wave 4 purple moved higher but remained below the price territory of wave 1 purple and the wave count remains valid. We now have nice alternation within the extended wave v orange: wave 2 purple is a sharp deep zigzag and wave 4 purple is a more shallow sideways moving regular flat correction.
Wave 5 purple is a perfect five wave impulse and is extremely likely to be complete. When price moves above 1,421.12 then upwards movement may not be a second wave correction within wave 5 purple and wave 5 purple would have to be over. At that stage we may have some confidence in this wave count, at least on the hourly chart level. We may expect that we have had at least a short term trend change.
There is no Fibonacci ratio between waves (a) and (c) green.
Ratios within wave (c) green are: wave iii orange is 0.93 points short of 2.618 the length of wave i orange, and wave v orange is 2.1 points longer than equality in length with wave i orange and is also 1.17 points longer than 2.618 the length of wave i orange.
Ratios within wave v orange extension are: wave 3 purple has no Fibonacci ratio to wave 1 purple, and wave 5 purple is just 0.62 points short of 0.618 the length of wave 3 purple.
We may redraw the parallel channel about wave v orange extension. When this channel is clearly breached by upwards movement then wave v orange is over and it is very likely that wave 4 blue at all degrees would be over.
Movement above the green parallel channel drawn about the zigzag of wave y pink would provide trend channel confirmation that the downwards correction is over and the upwards trend has resumed.
While price remains below 1,421.12 the invalidation point must remain at 1,380.39. While we do not have confirmation that the downwards correction is over we must accept the possibility that it may continue. If it does then wave 4 blue may not move into wave 1 blue price territory. This wave count is invalidated with movement below 1,380.39.
Second Daily Wave Count.
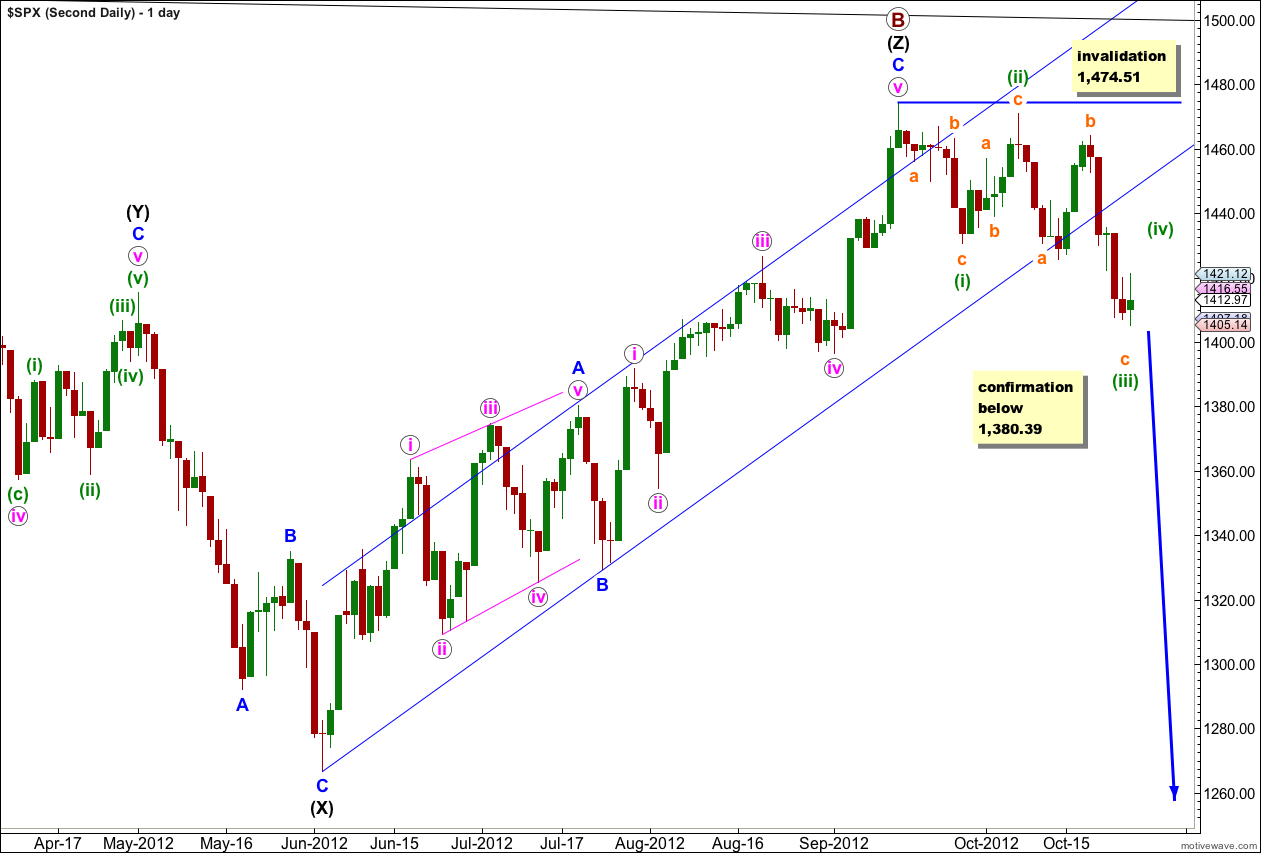
It remains possible that we have recently seen a major trend change in the S&P 500 and the DJIA. We should not place any confidence in this wave count prior to confirmation of a trend change with movement below 1,380.39.
We should always assume that the trend remains the same, until proven otherwise. At this stage we have a little indication of a trend change with a clear channel breach, but we will not have price confirmation until we see movement below 1,380.39 invalidating the first daily wave count.
The upper black line is the upper edge of a parallel channel drawn on the monthly chart. This area may have provided resistance.
The channel drawn about the zigzag of wave (Z) black using Elliott’s technique for a correction is very clearly breached. This is some indication that this wave count may be correct and we may have seen a trend change.
Within the new downwards trend no second wave correction may move beyond the start of the first wave. This wave count is invalidated with any movement above 1,474.51.
If we are in a new downwards trend then it may be an unfolding leading diagonal. Waves (i) through to (iii) green subdivide into a zigzags.
Alternatively, we may have seen a series of overlapping first and second waves. If downwards movement increases in momentum it could be the middle of a strong third wave unfolding.
If price breaks below 1,380.39 then this would be the preferred wave count and we should expect a new downwards trend for months. At that stage I would calculate downwards targets for you. To do so prior to confirmation would be premature.
Ending Diagonal Formation ??
The S&P 500 Futures would have to make one more new low under ES 1394.50 next week.
1377 Support
Looks like …. ES 1391 to END the ABC wave down from yesterday’s high 1416.75
LOD 1394.50 at this point…