
Last analysis expected more downwards movement to a short term target at 1,425 to 1,424. Price has reached just 1.94 points below the small target zone before turning upwards at the end of Monday’s session. This is exactly what was expected.
I have the same two daily wave counts which now diverge. They are also different at cycle degree on monthly charts. Members may review monthly charts here.
Click on the charts below to enlarge.
First Daily Wave Count.
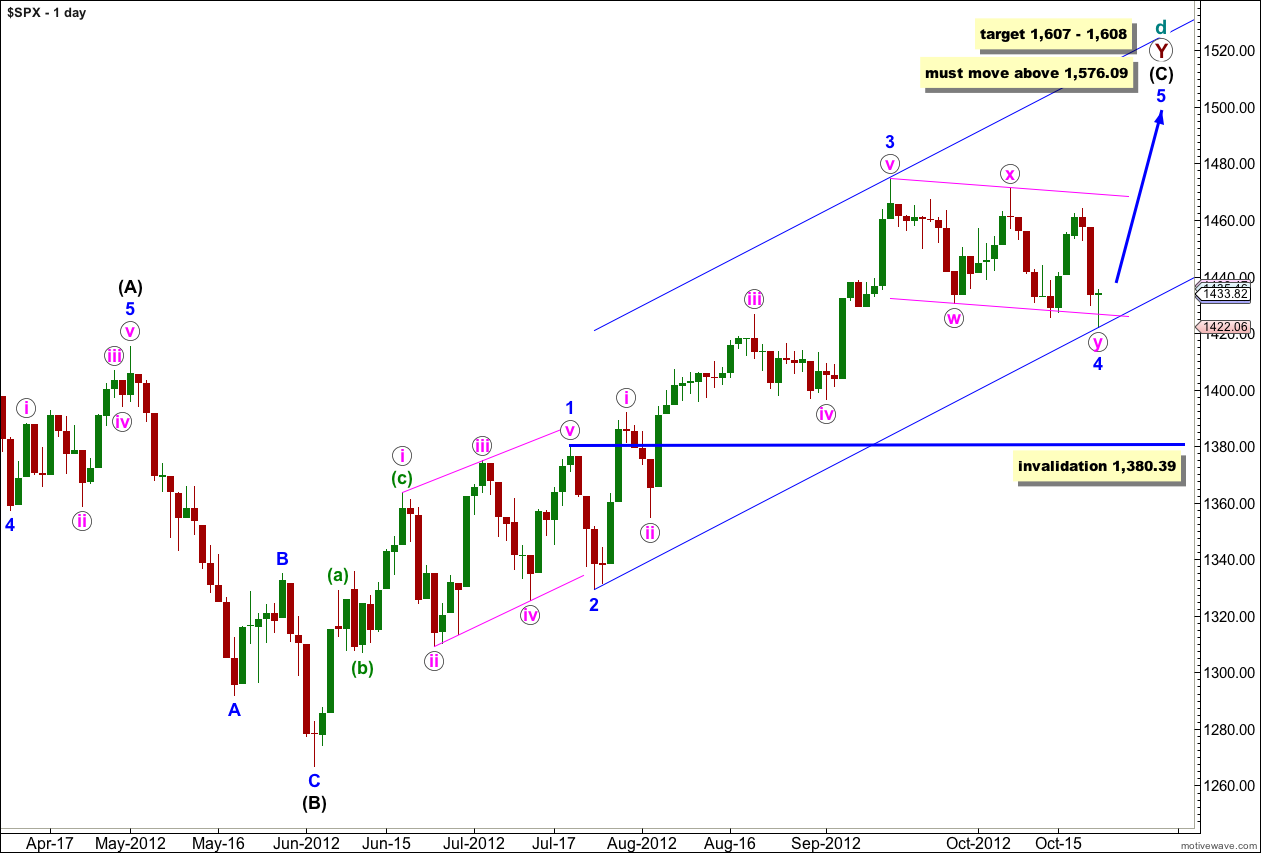
At super cycle degree this wave count sees a very rare expanding triangle unfolding, and cycle wave d upwards within the triangle is a double zigzag which must move beyond the end of cycle wave b.
Within the second zigzag of the double, primary wave Y, wave (C) black must unfold as a five wave structure.
Waves 1 through to 3 blue are complete. Wave 2 blue unfolded as a brief zigzag, and wave 4 blue looks like a double zigzag exhibiting alternation.
Further downwards movement for wave 4 blue may not move into wave 1 blue price territory. This wave count is invalidated with movement below 1,380.39.
At 1,607 wave (C) black would reach equality in length with wave (A) black. At 1,608 wave 5 blue would reach 1.618 the length of wave 1 blue.
At this length wave 5 blue would be time consuming and extended. Wave 1 blue lasted 32 days, wave 3 blue lasted 37 days. I would expect wave 5 blue to be more long lasting than this, possibly about 55 days.
Elliott’s second channeling technique is used about this impulse of wave (C) black. The first trend line is drawn from the lows of 2 to 4 blue, then a parallel copy is placed upon the high of wave 3 blue. Wave 5 blue should end either mid way within the channel or about the upper edge.
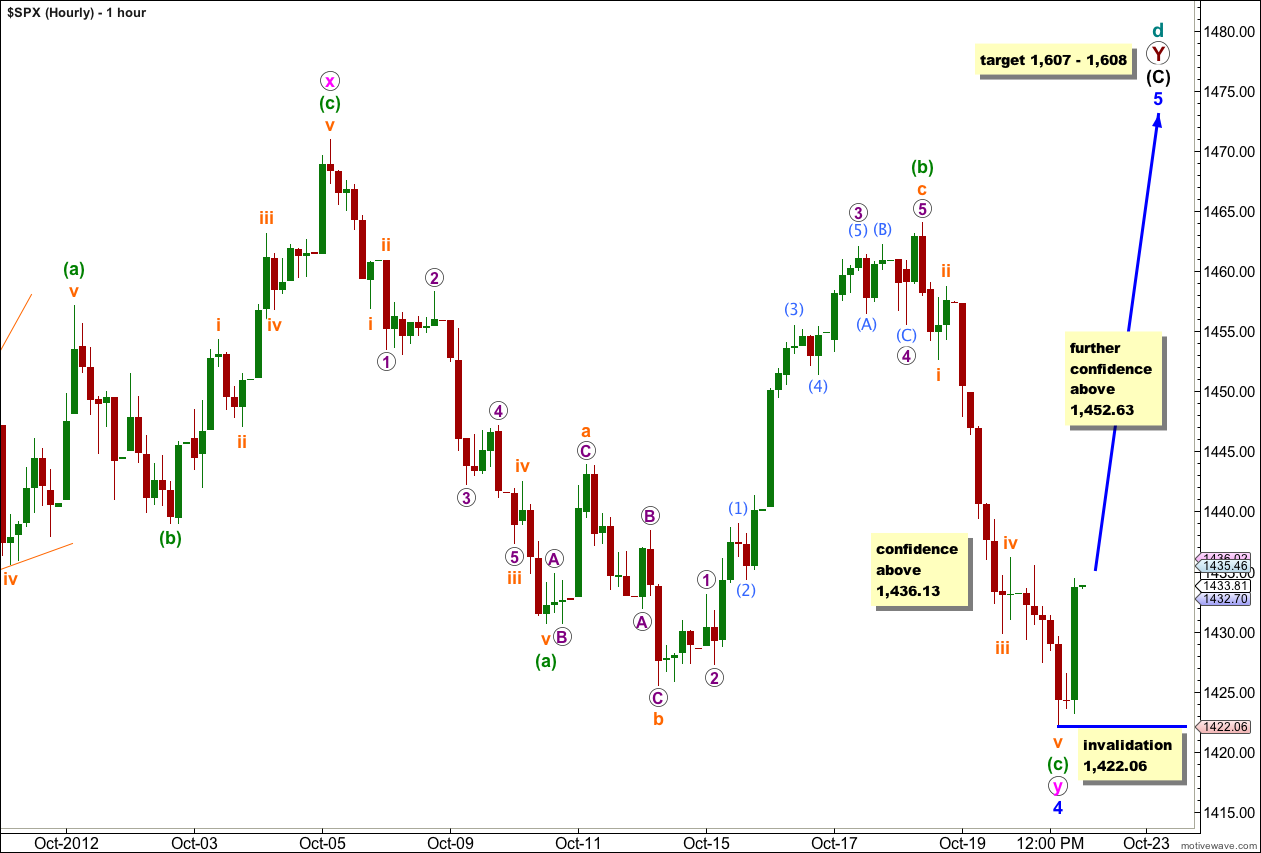
At the end of the session it looks like we have a Morning Star candlestick pattern indicating a trend change. This adds a little more confidence to this wave count.
Wave (c) green is just 1.64 points longer than equality with wave (a) green.
Ratios within wave (c) green are: wave iii orange is just 0.93 points short of 2.618 the length of wave i orange, and wave v orange has no Fibonacci ratio to either of i or iii orange.
Movement above 1,436.13 would move price beyond the start of wave 1 within wave v orange and could not be a second wave correction within wave v orange. At that stage wave v orange would have to be over. This would add further confidence to the resumption of the upwards trend.
Movement above 1,452.63 may not be a fourth wave correction within wave (c) green and so wave (c) green would have to be over. This would add further confidence to the resumption of the upwards trend.
Within wave 5 blue no second wave correction may move beyond the start of the first wave. This wave count is invalidated with movement below 1,422.06.
Second Daily Wave Count.

It remains possible that we have recently seen a major trend change in the S&P 500 and the DJIA. We should not place any confidence in this wave count prior to confirmation of a trend change with movement below 1,380.39.
We should always assume that the trend remains the same, until proven otherwise. At this stage we have absolutely no confirmation of a trend change. We will not have confirmation until price moves below 1,380.39 invalidating the first daily wave count.
Within the new downwards trend no second wave correction may move beyond the start of the first wave. This wave count is invalidated with any movement above 1,474.51.
If we are in a new downwards trend then it would be an unfolding leading diagonal. Waves (i) through to (iii) green subdivide into a zigzags.
Please disregard my question. I see you have already answered it. This is what I was thinking as well.
No worries 🙂
Yep. Extremely likely 5 will extend.
On the first daily count, neither wave 1 blue nor 3 blue have extended. What is the probability of wave 5 blue thus extending?